Fruit Ranking!
About The Survey
A few weeks ago on a late-night walk home after getting ice cream with my girlfriend, we started talking about the best/worst kinds of fruit in ice cream, which led to a large conversation about fruits. We started asking each other fruits and assigning them to a category using a tier list system, ranging from A to F. While we agreed on most fruits, some hot takes were taken and some schisms in preference were revealed. This was the genesis of an informal fruit ranking process that I unleashed in just about any social situation that would generally lead to a good argument. So after a few weeks of asking the friends to rank fruits, I decided to write a survey to definitively prove what a non-random sample of people in my social periphery think about fruits. The first obstacle was picking the fruit; I wanted to have a lot of options without overwhelming respondents or selecting obscure fruits, leading respondents to just pick randomly to get through the survey. Some shortcuts were taken, such as only having an option for red and green apples and not splitting up grapes, leading to a fair amount of outcry.
As of writing this, the survey fielded 450(!) completes within the first few days and is currently still open and can be found here: https://goo.gl/forms/92TnNIjexX4Maam63. I will continue to collect responses for the foreseeable future, updating the analysis whenever possible. So if you are reading this and haven’t taken the survey yet, please stop and take the survey now to contribute your closely held fruit opinions. Thank you to everyone who took the time to complete and share this completely frivolous but important bit of research.
A note of caution for those seeking to draw larger conclusions from this data, the survey is in no way representative of a larger population (Unless the US is suddenly much more female and way more liberal than the current affairs would have me believe). For a full breakdown of the survey demographics, see the table in the Appendix.
In order to account for the demographic skew in the data, I weighted the results on gender, age and race to the US adult population. However, since the survey is so wildly disproportionately skewed and not even close to be a random sample of the US population, I decided that any post-stratification weighting or extrapolation to the general population would be a stretch. Even just weighting to age, gender, and race resulted in some crazy high weights. The weighted results can be found in the Appendix, but won’t be the the focus of the following analysis.
Fruit Ranking
On average, it’s clear that most people like most of the fruits presented. The majority of respondents rated the fruit items in the highest tiers: A & B, while only 16% of respondents ranked certain fruits in lowest tiers: D & F, on average.
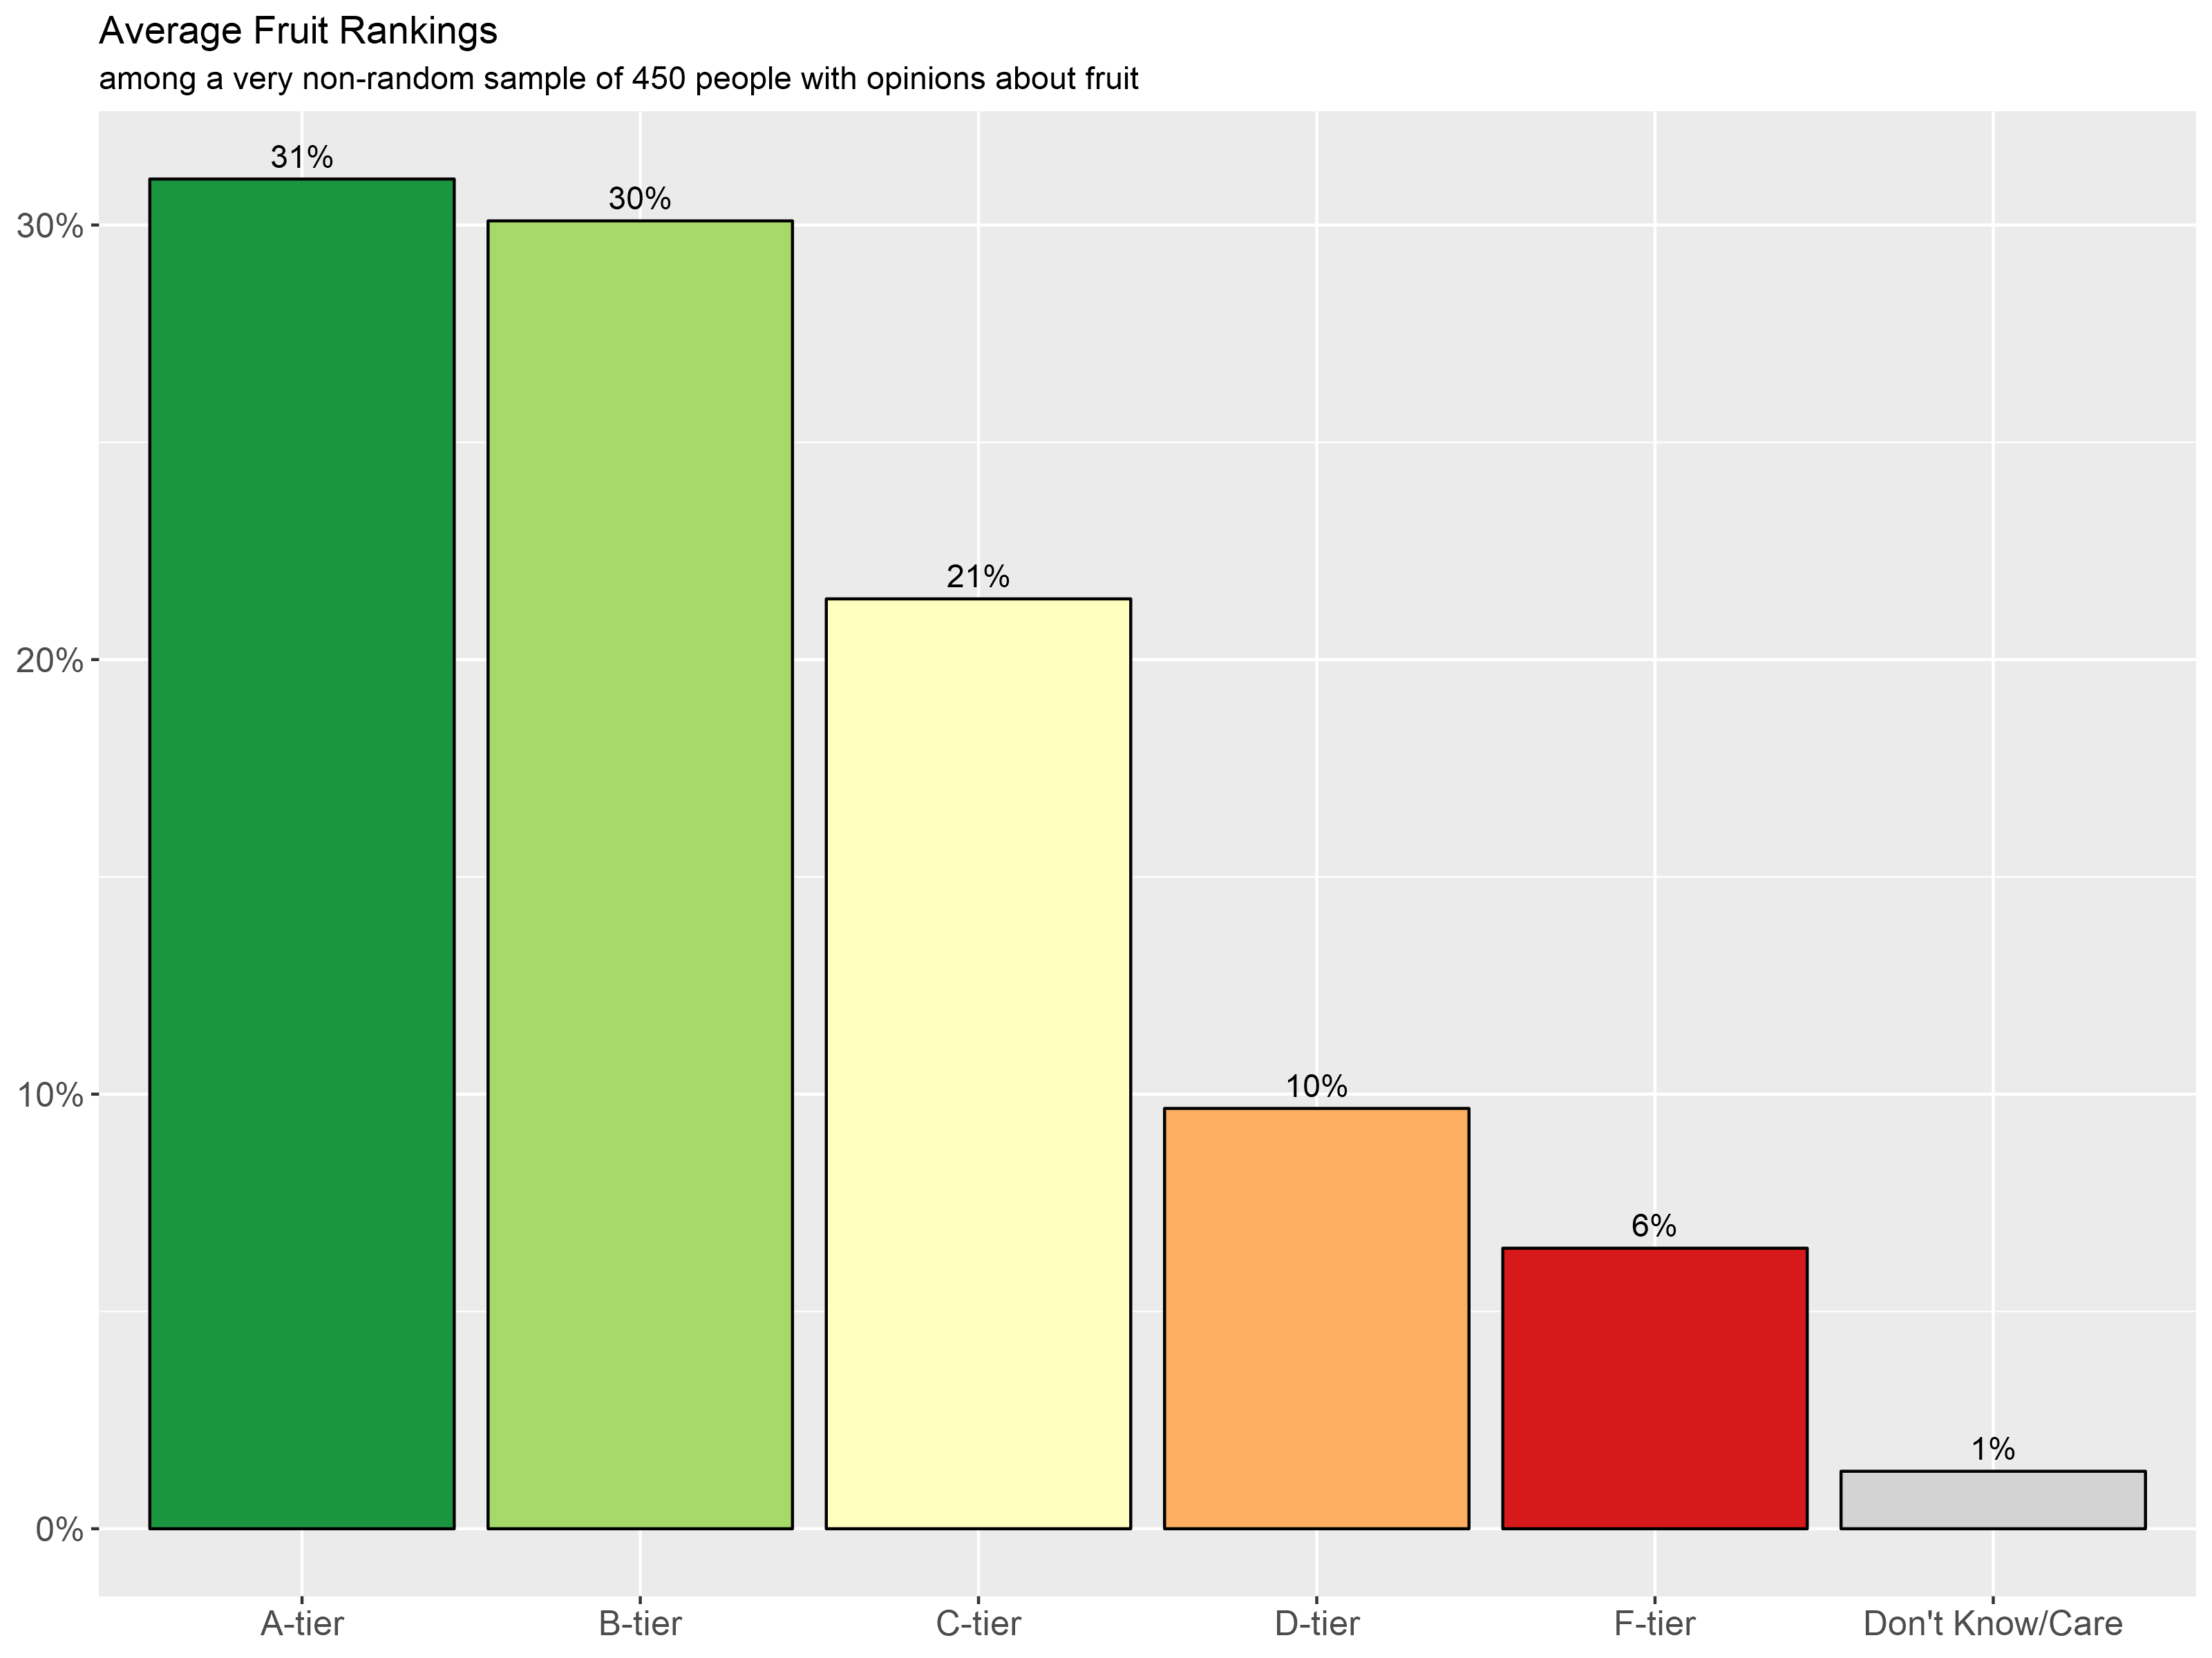
Looking at the overall responses another way, respondents doled out fewer F-tier ratings, only giving 1.35 F-tier ratings on average (represented by the blue line below) among the 21 fruits tested, compared to the 6.5 A-tier ratings given (represented by the red line below). The intermediary tiers fell in between these two values on average. The distribution of A and F-tier responses can be found below.

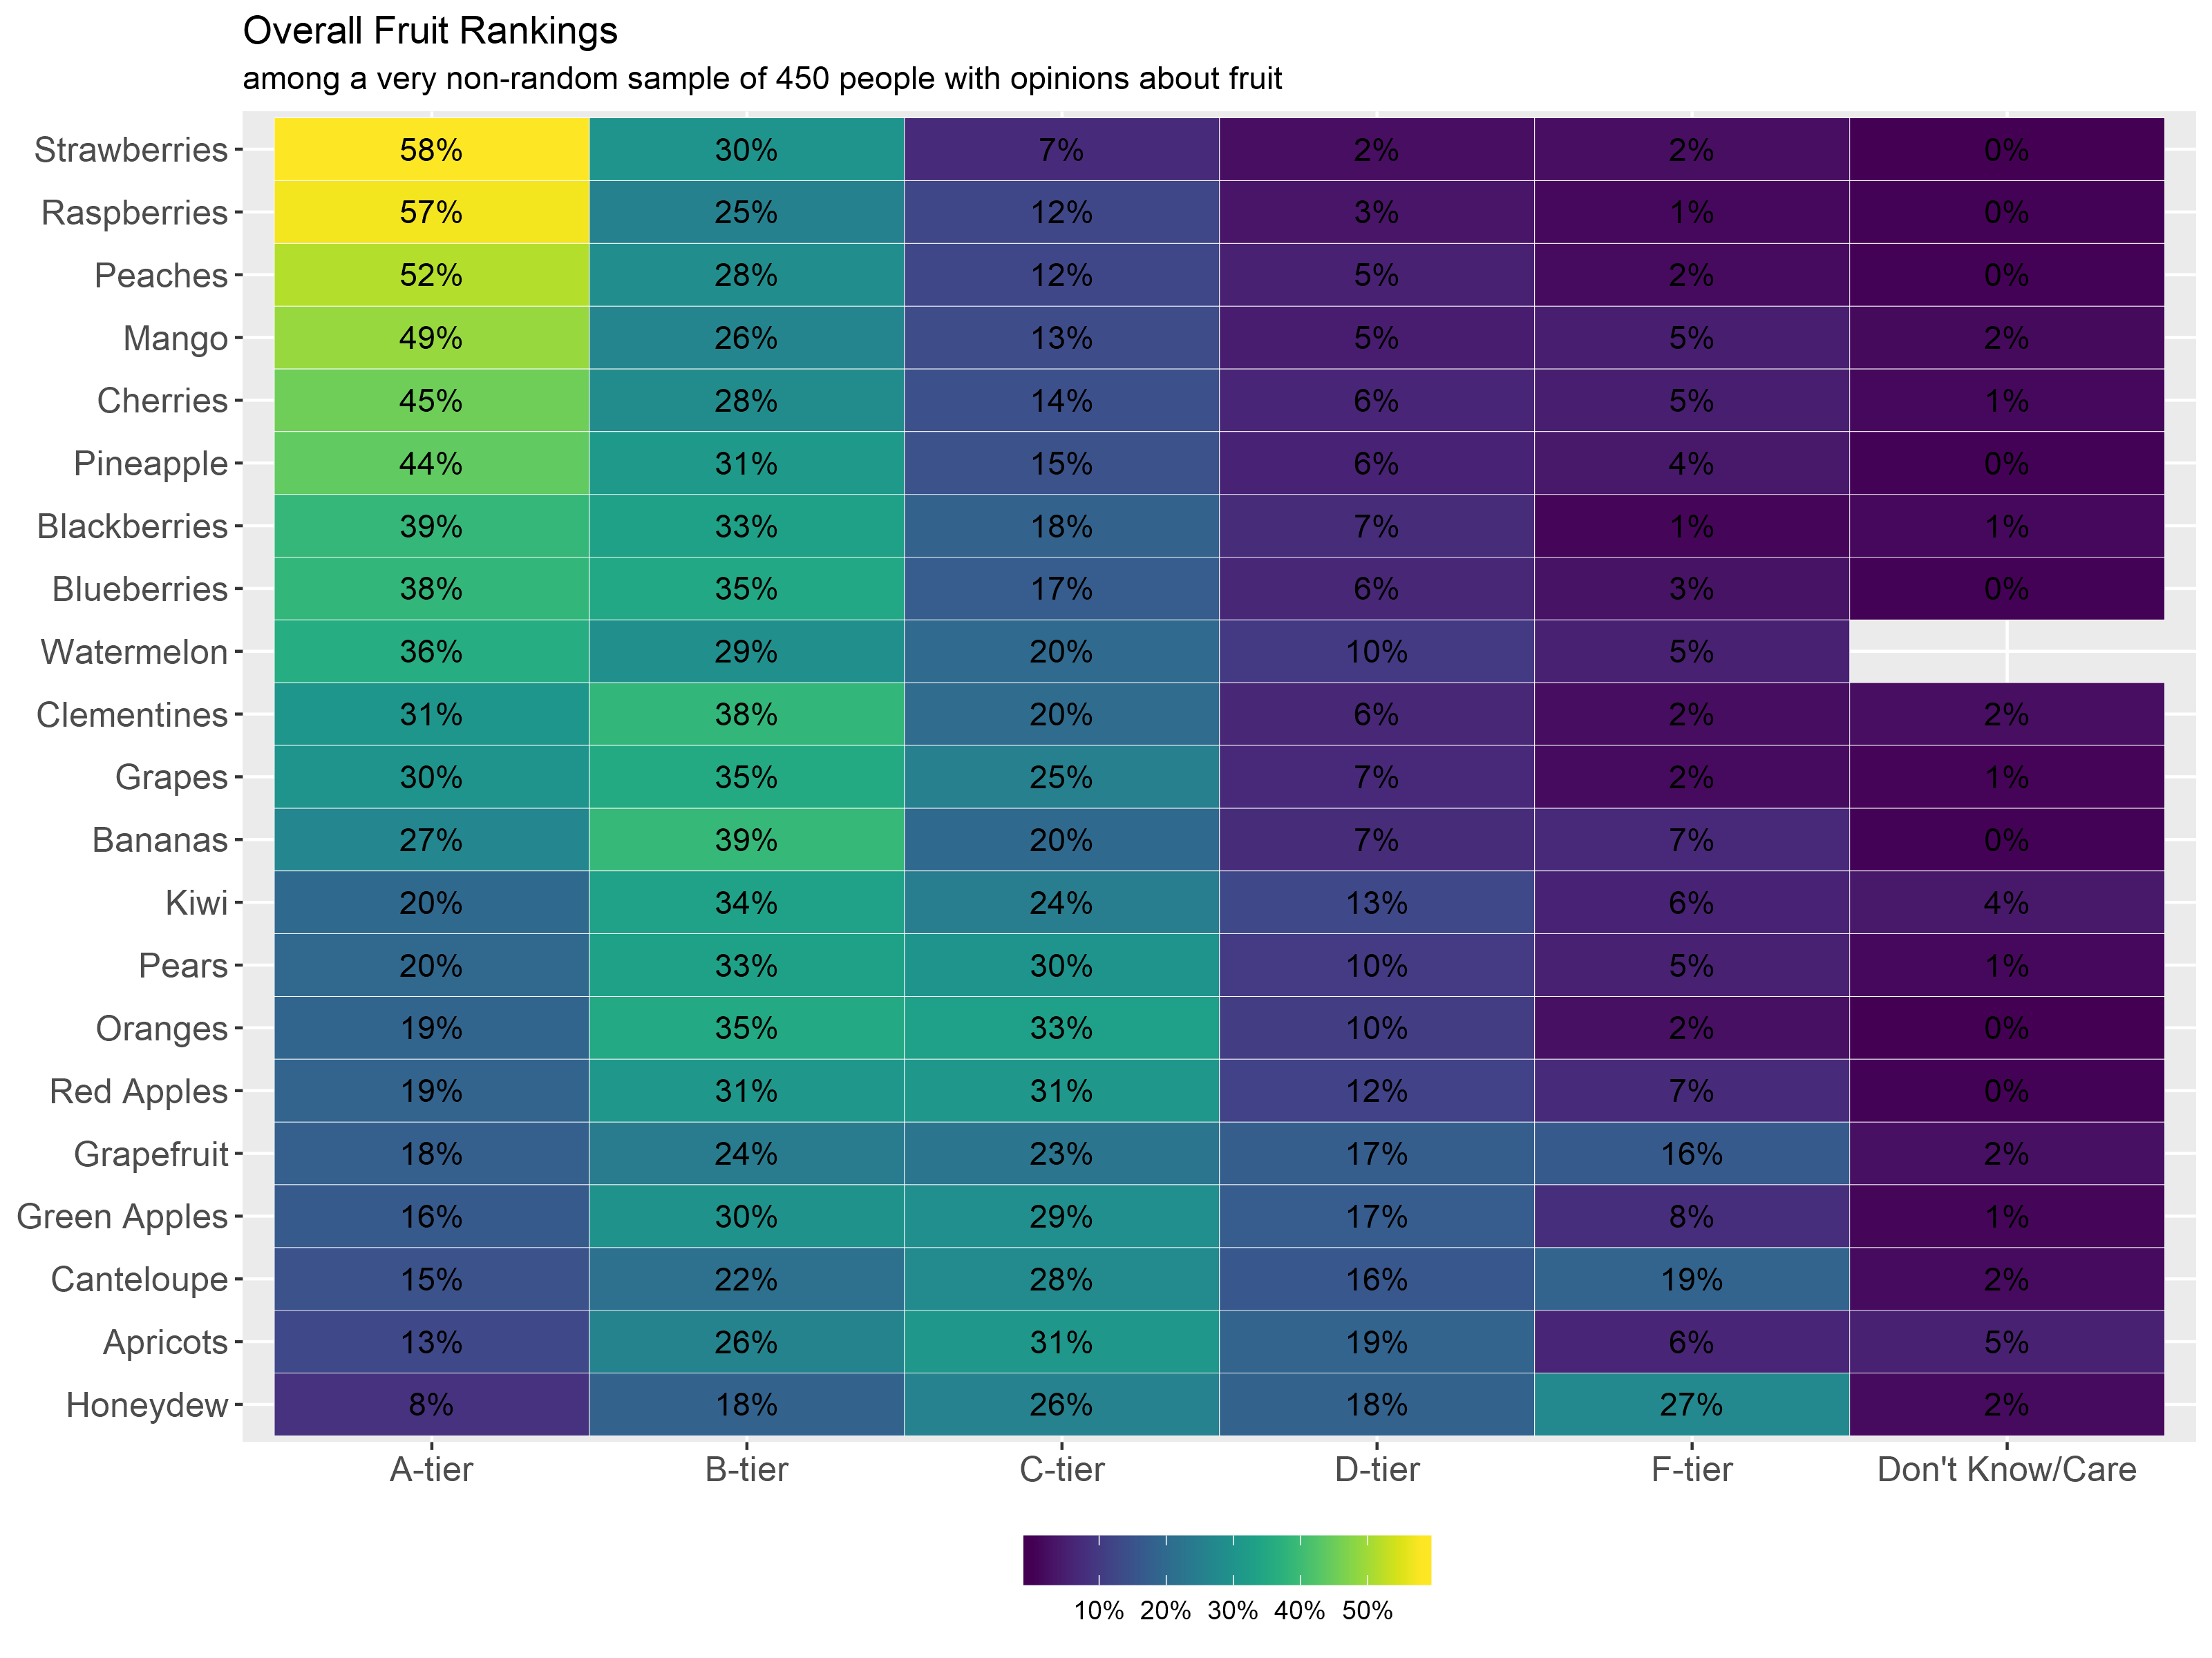
Overall, strawberries appear to be the crowd favorite (88% of respondents ranked the fruit as A or B-tier), narrowly beating out raspberries.
At the other end of the scale, the palpable hatred of honeydew stands out. 27% of respondents ranked the fruit F-tier – that’s equal to the total number of people ranking bananas as A-tier. Next in line at second from last are Apricots. However, unlike honeydew, apricots aren’t strongly disliked, rather they are a good example of a C-tier fruit.
Along with honeydew, cantaloupe and grapefruit have the highest proportion of F-tier ratings among the fruits tested.
Next, to examine the relationship between fruits, I ran a correlation matrix for all of the fruits tested. The green shading represents positive relationships, while the red indicates negative. Most of the fruits have positive, if weak, relationships with one another.
The strongest positive relationship is observed between honeydew and cantaloupe, with an R-squared of 0.66; meaning that if a respondent rated honeydew/cantaloupe favorably, then they most likely rated the other fruit favorably. Interestingly, cantaloupe and honeydew have some of the strongest negative correlations with raspberries.
The two citrus fruits tested, oranges and clementines, are both positively correlated. This validates what we’d expect; if you like clementines, then you most likely also like oranges.

Fruit Ranking by Demographics
For the remainder of this analysis, I’m going to introduce a new unit of measurement: the Fruit GPA TM. Because survey respondents were asked to assign fruits to a grade-level tier, we can convert these values into a numerical scale and take the average, like a GPA.
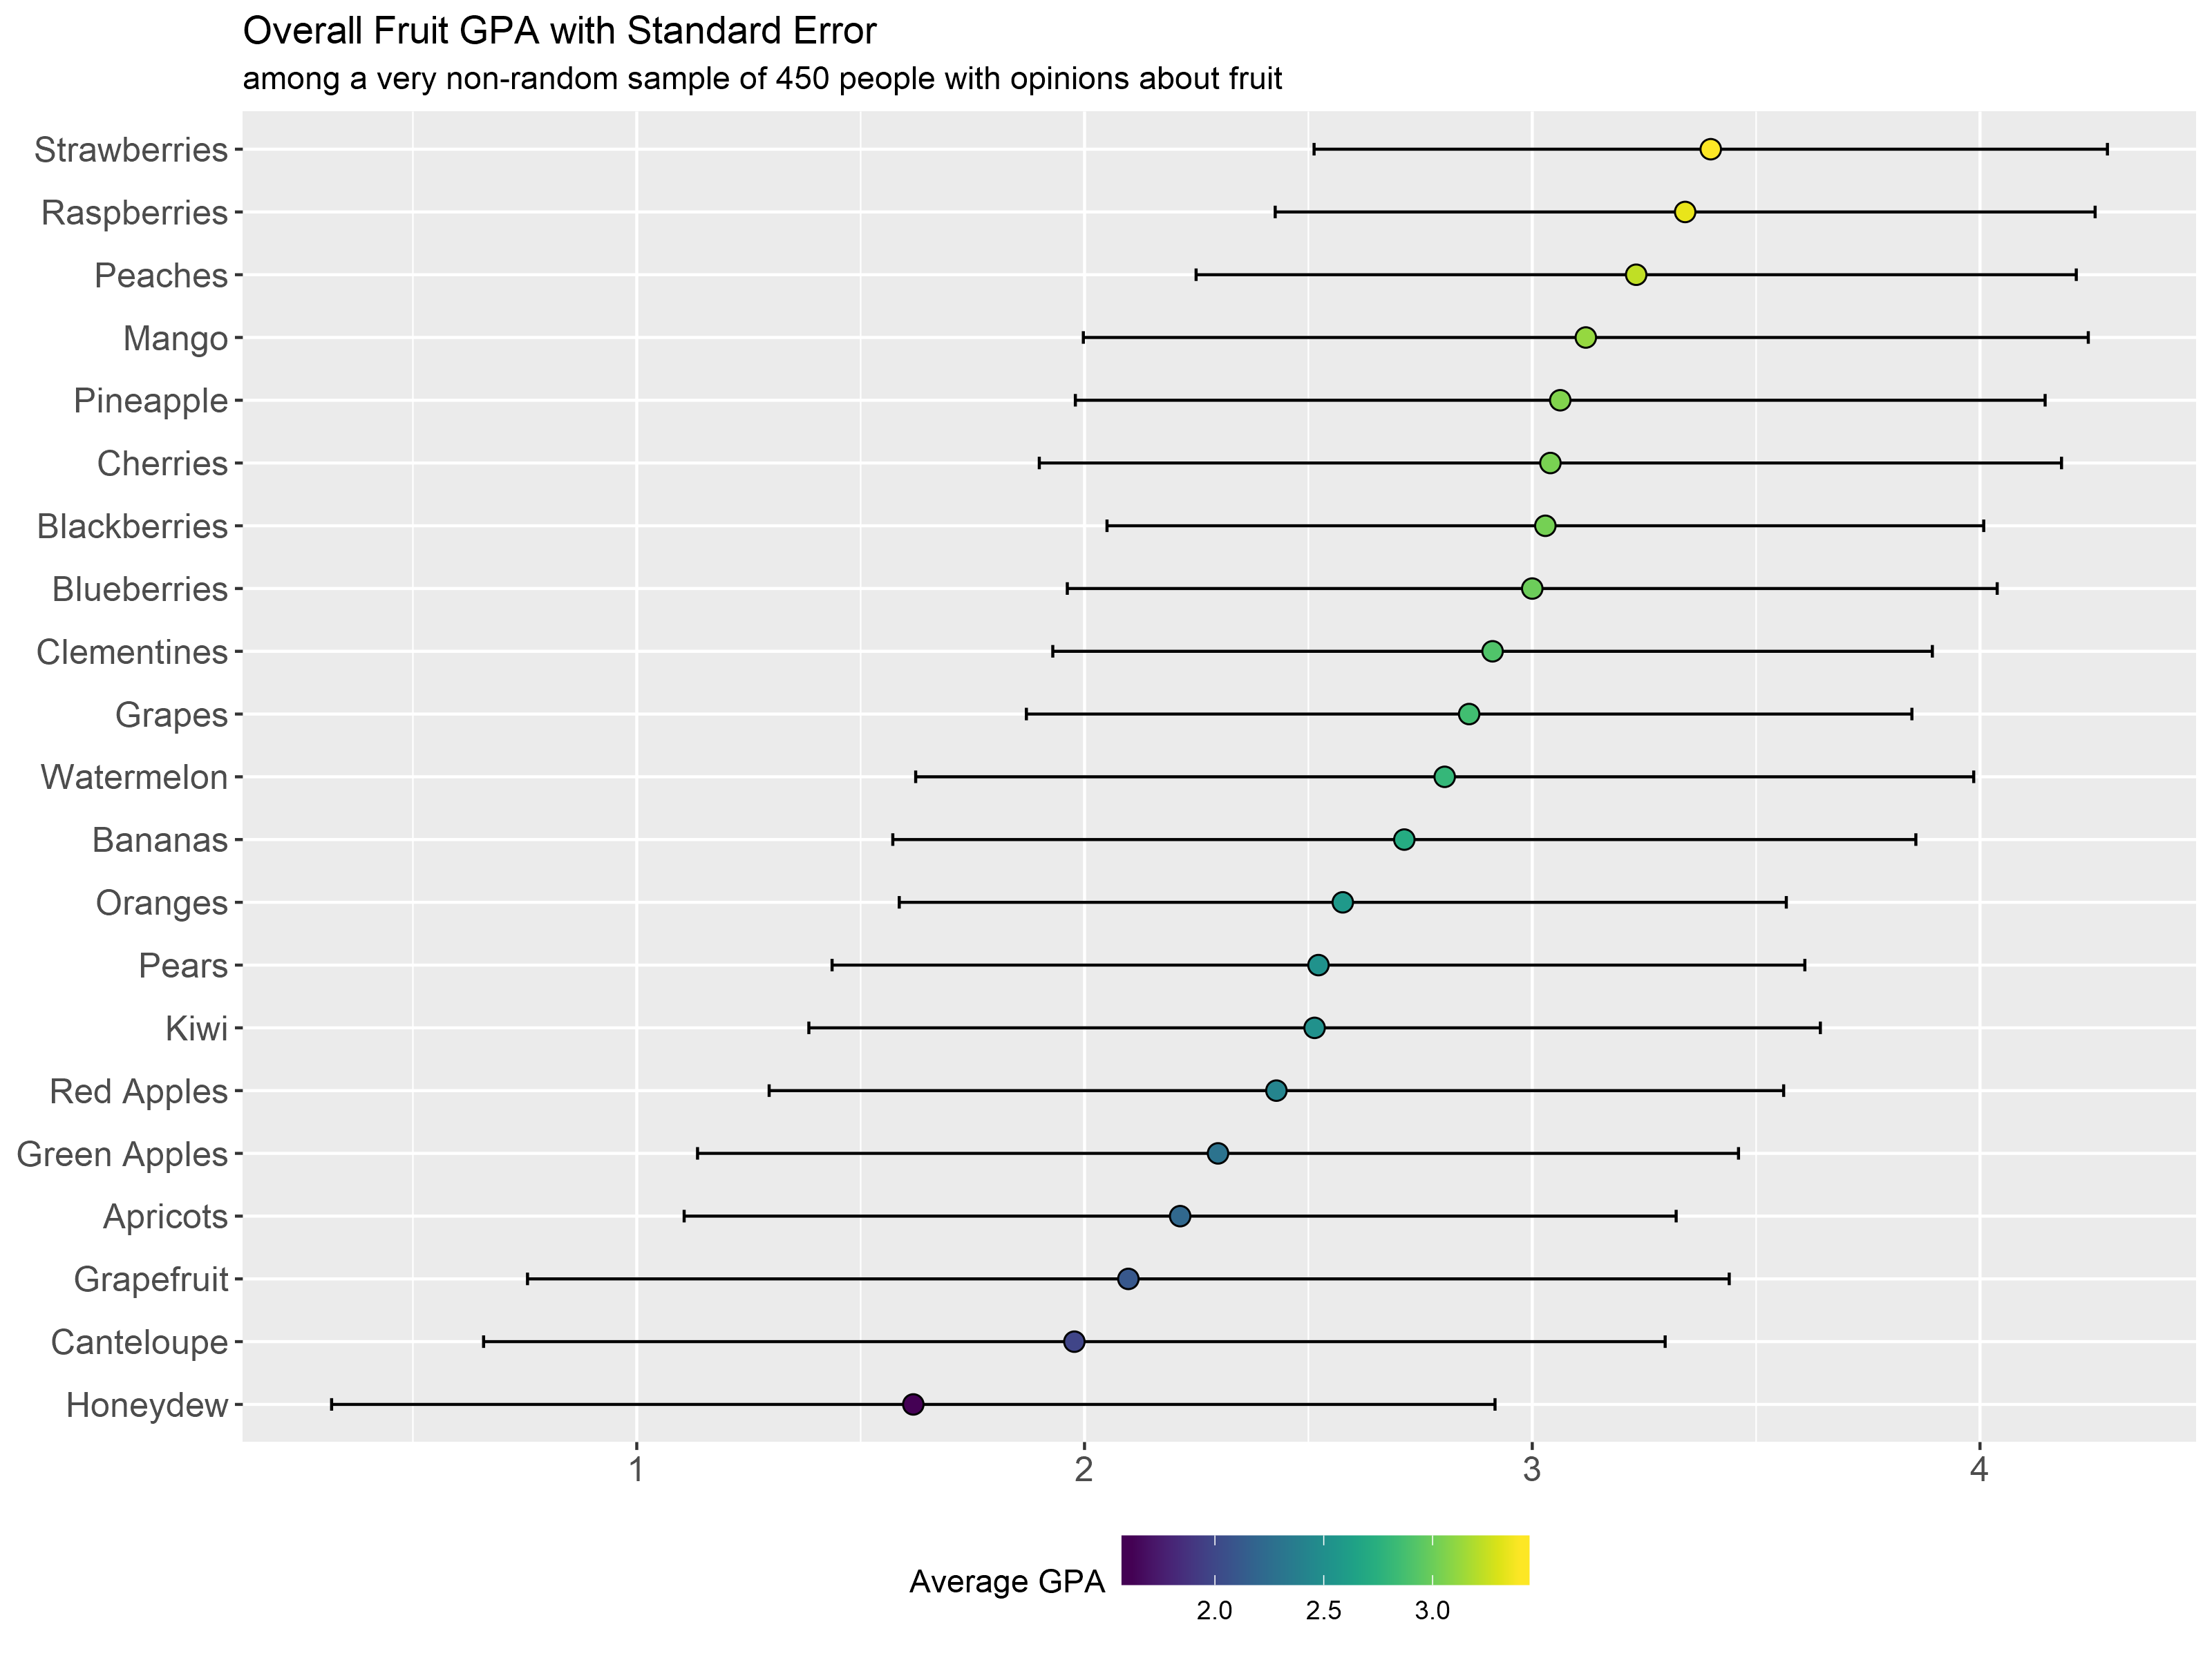
The plot below shows the overall distribution of the fruits by their Fruit GPA score. We see a ranking that is relatively similar to the previous chart with the fruits ordered by A-tier percent. More importantly this chart also shows the standard error calculated from the standard deviation for each of the fruits. Fruits such as grapefruit, honeydew, and cantaloupe have the largest standard deviations (1.34, 1.32, and 1.30 respectively) compared to the more popular fruits like strawberries and raspberries with smaller standard deviations (.88 and .92). The higher standard deviation for our relatively unpopular fruits indicates a relatively wider distribution/variation of ratings from the average, while the opposite is true for our popular fruits.
Lastly, you can probably notice that all the standard error bars are overlapping, indicating that there isn’t a statistically significant difference in opinions towards any of the fruit tested. Guess there goes any shot I had at getting this study published.
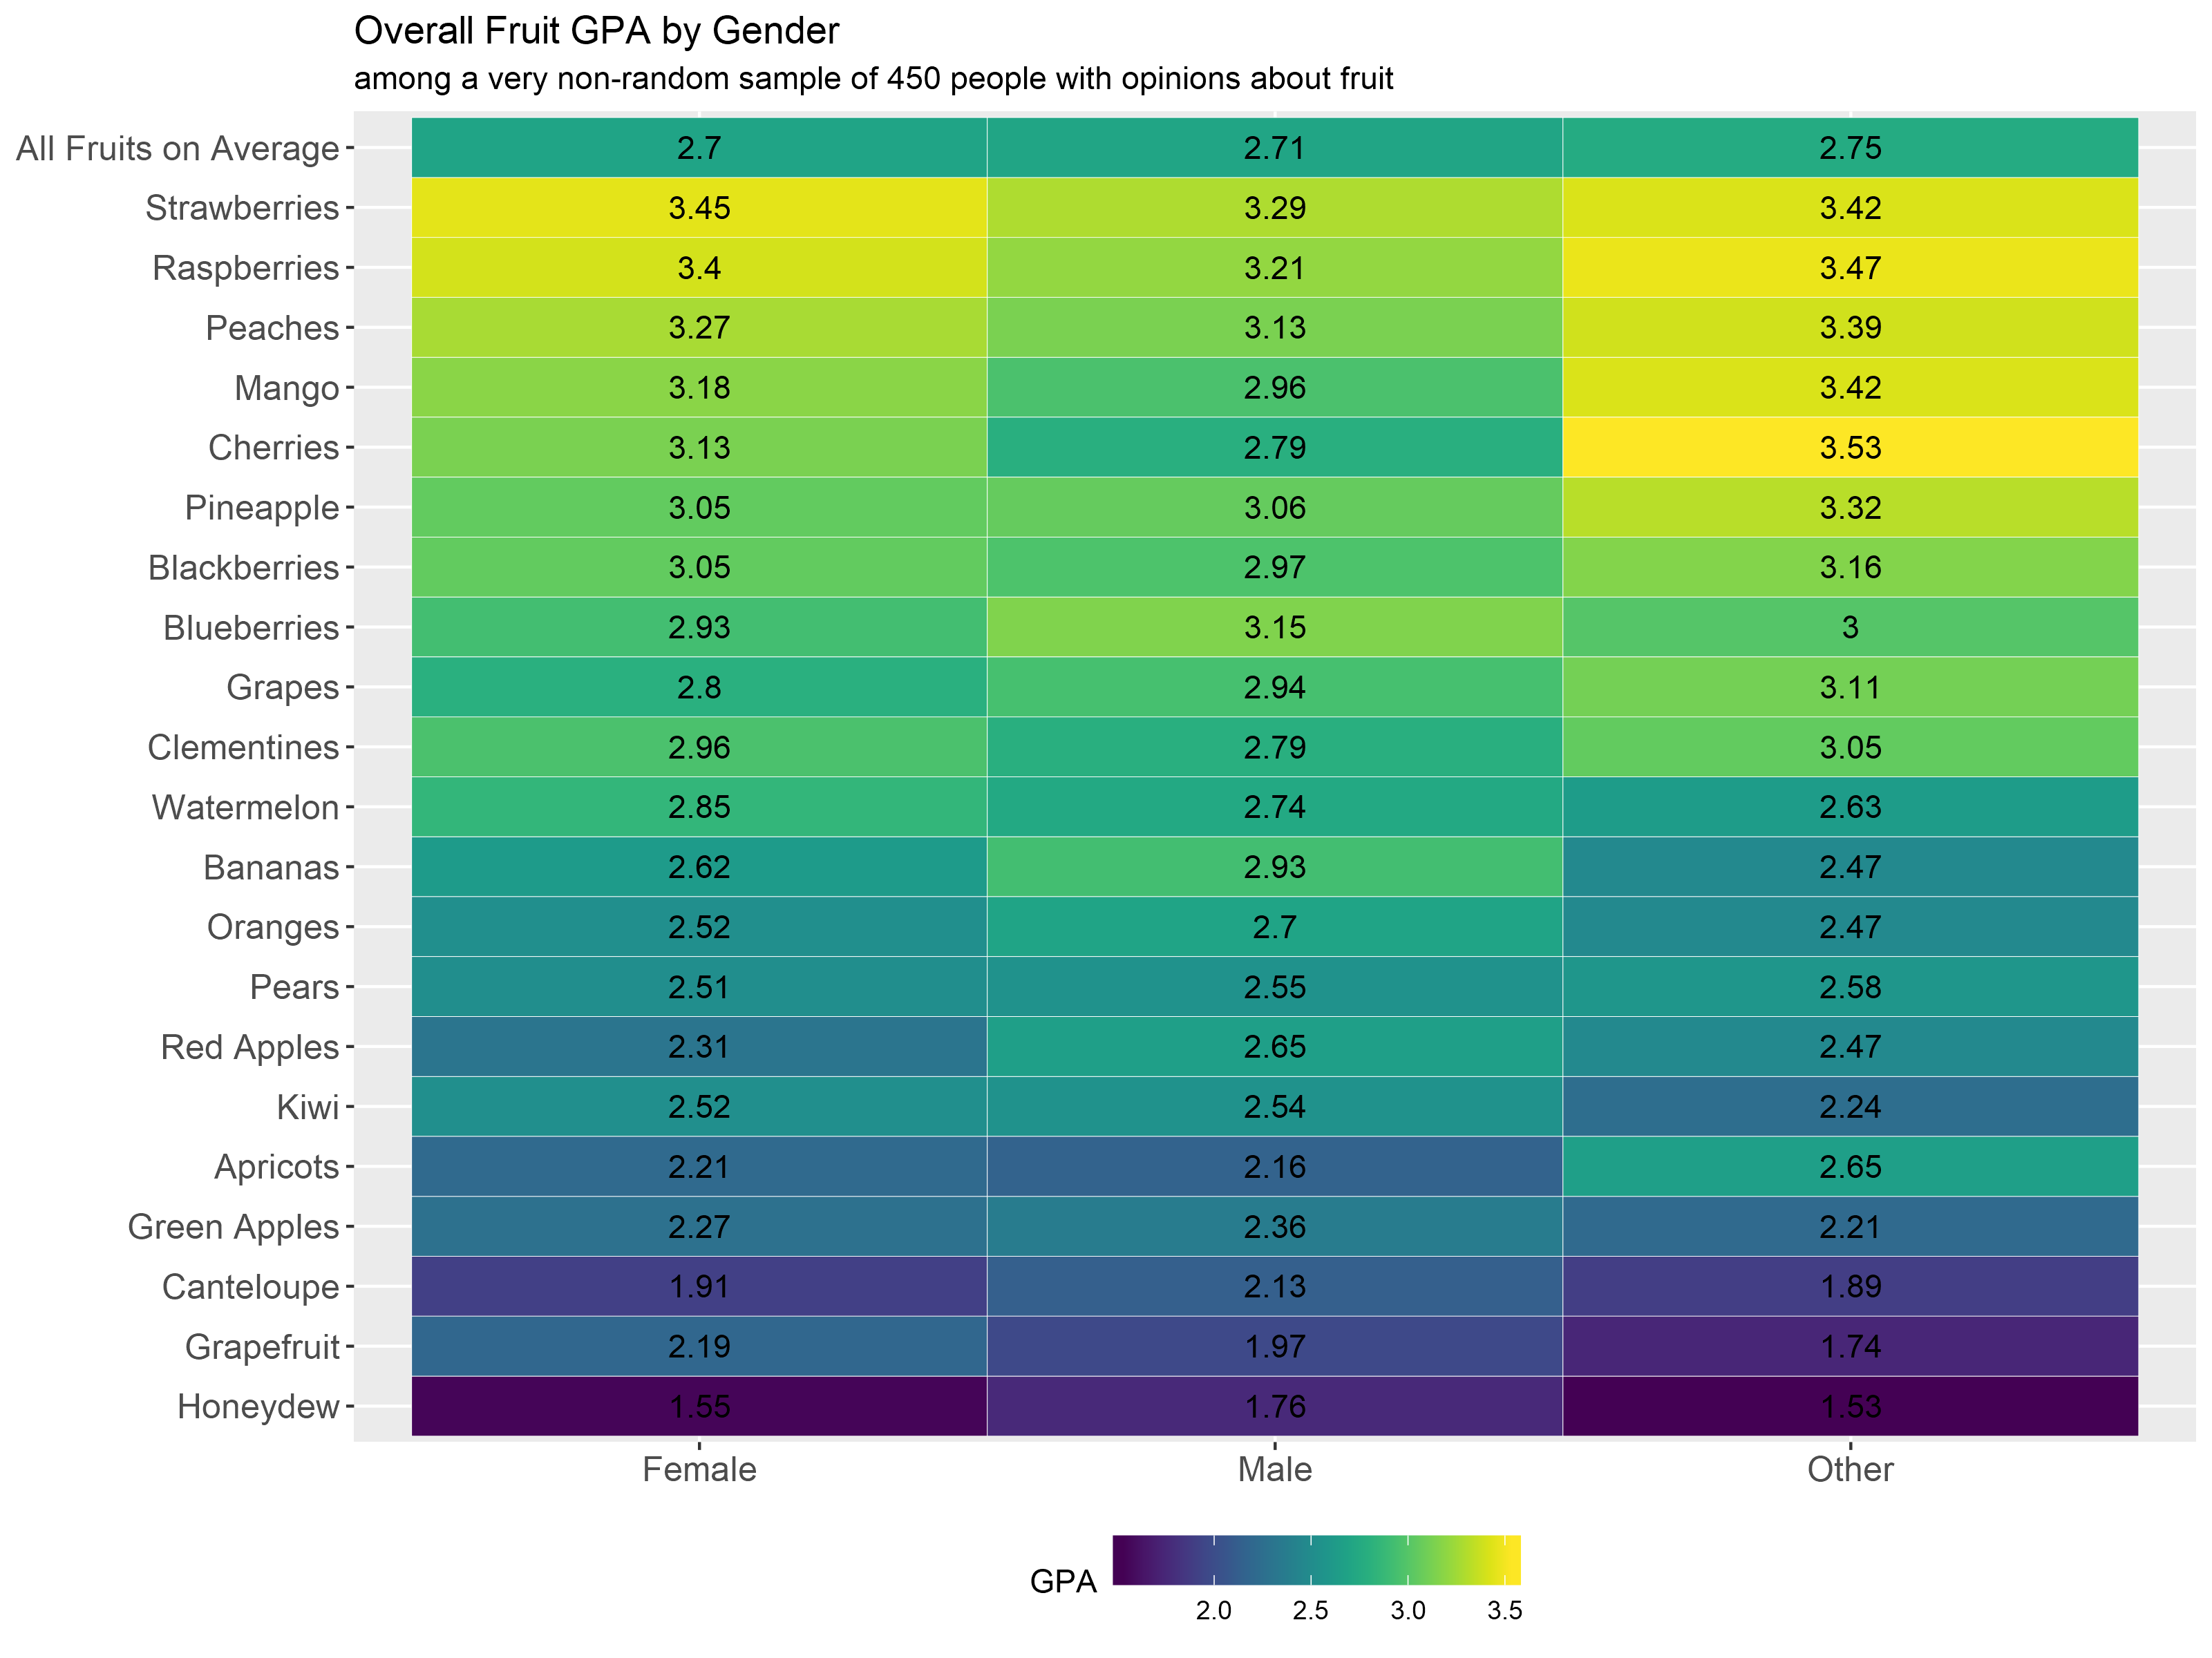
Looking at the Fruit GPA scores by respondent gender, men tend to be more lukewarm towards the fruit tested across the board. Women show stronger preference towards strawberries and raspberries, and a much stronger aversion towards honeydew and cantaloupe. The highest rating of all fruits tested goes to Cherries at 3.53 among non-binary respondents.
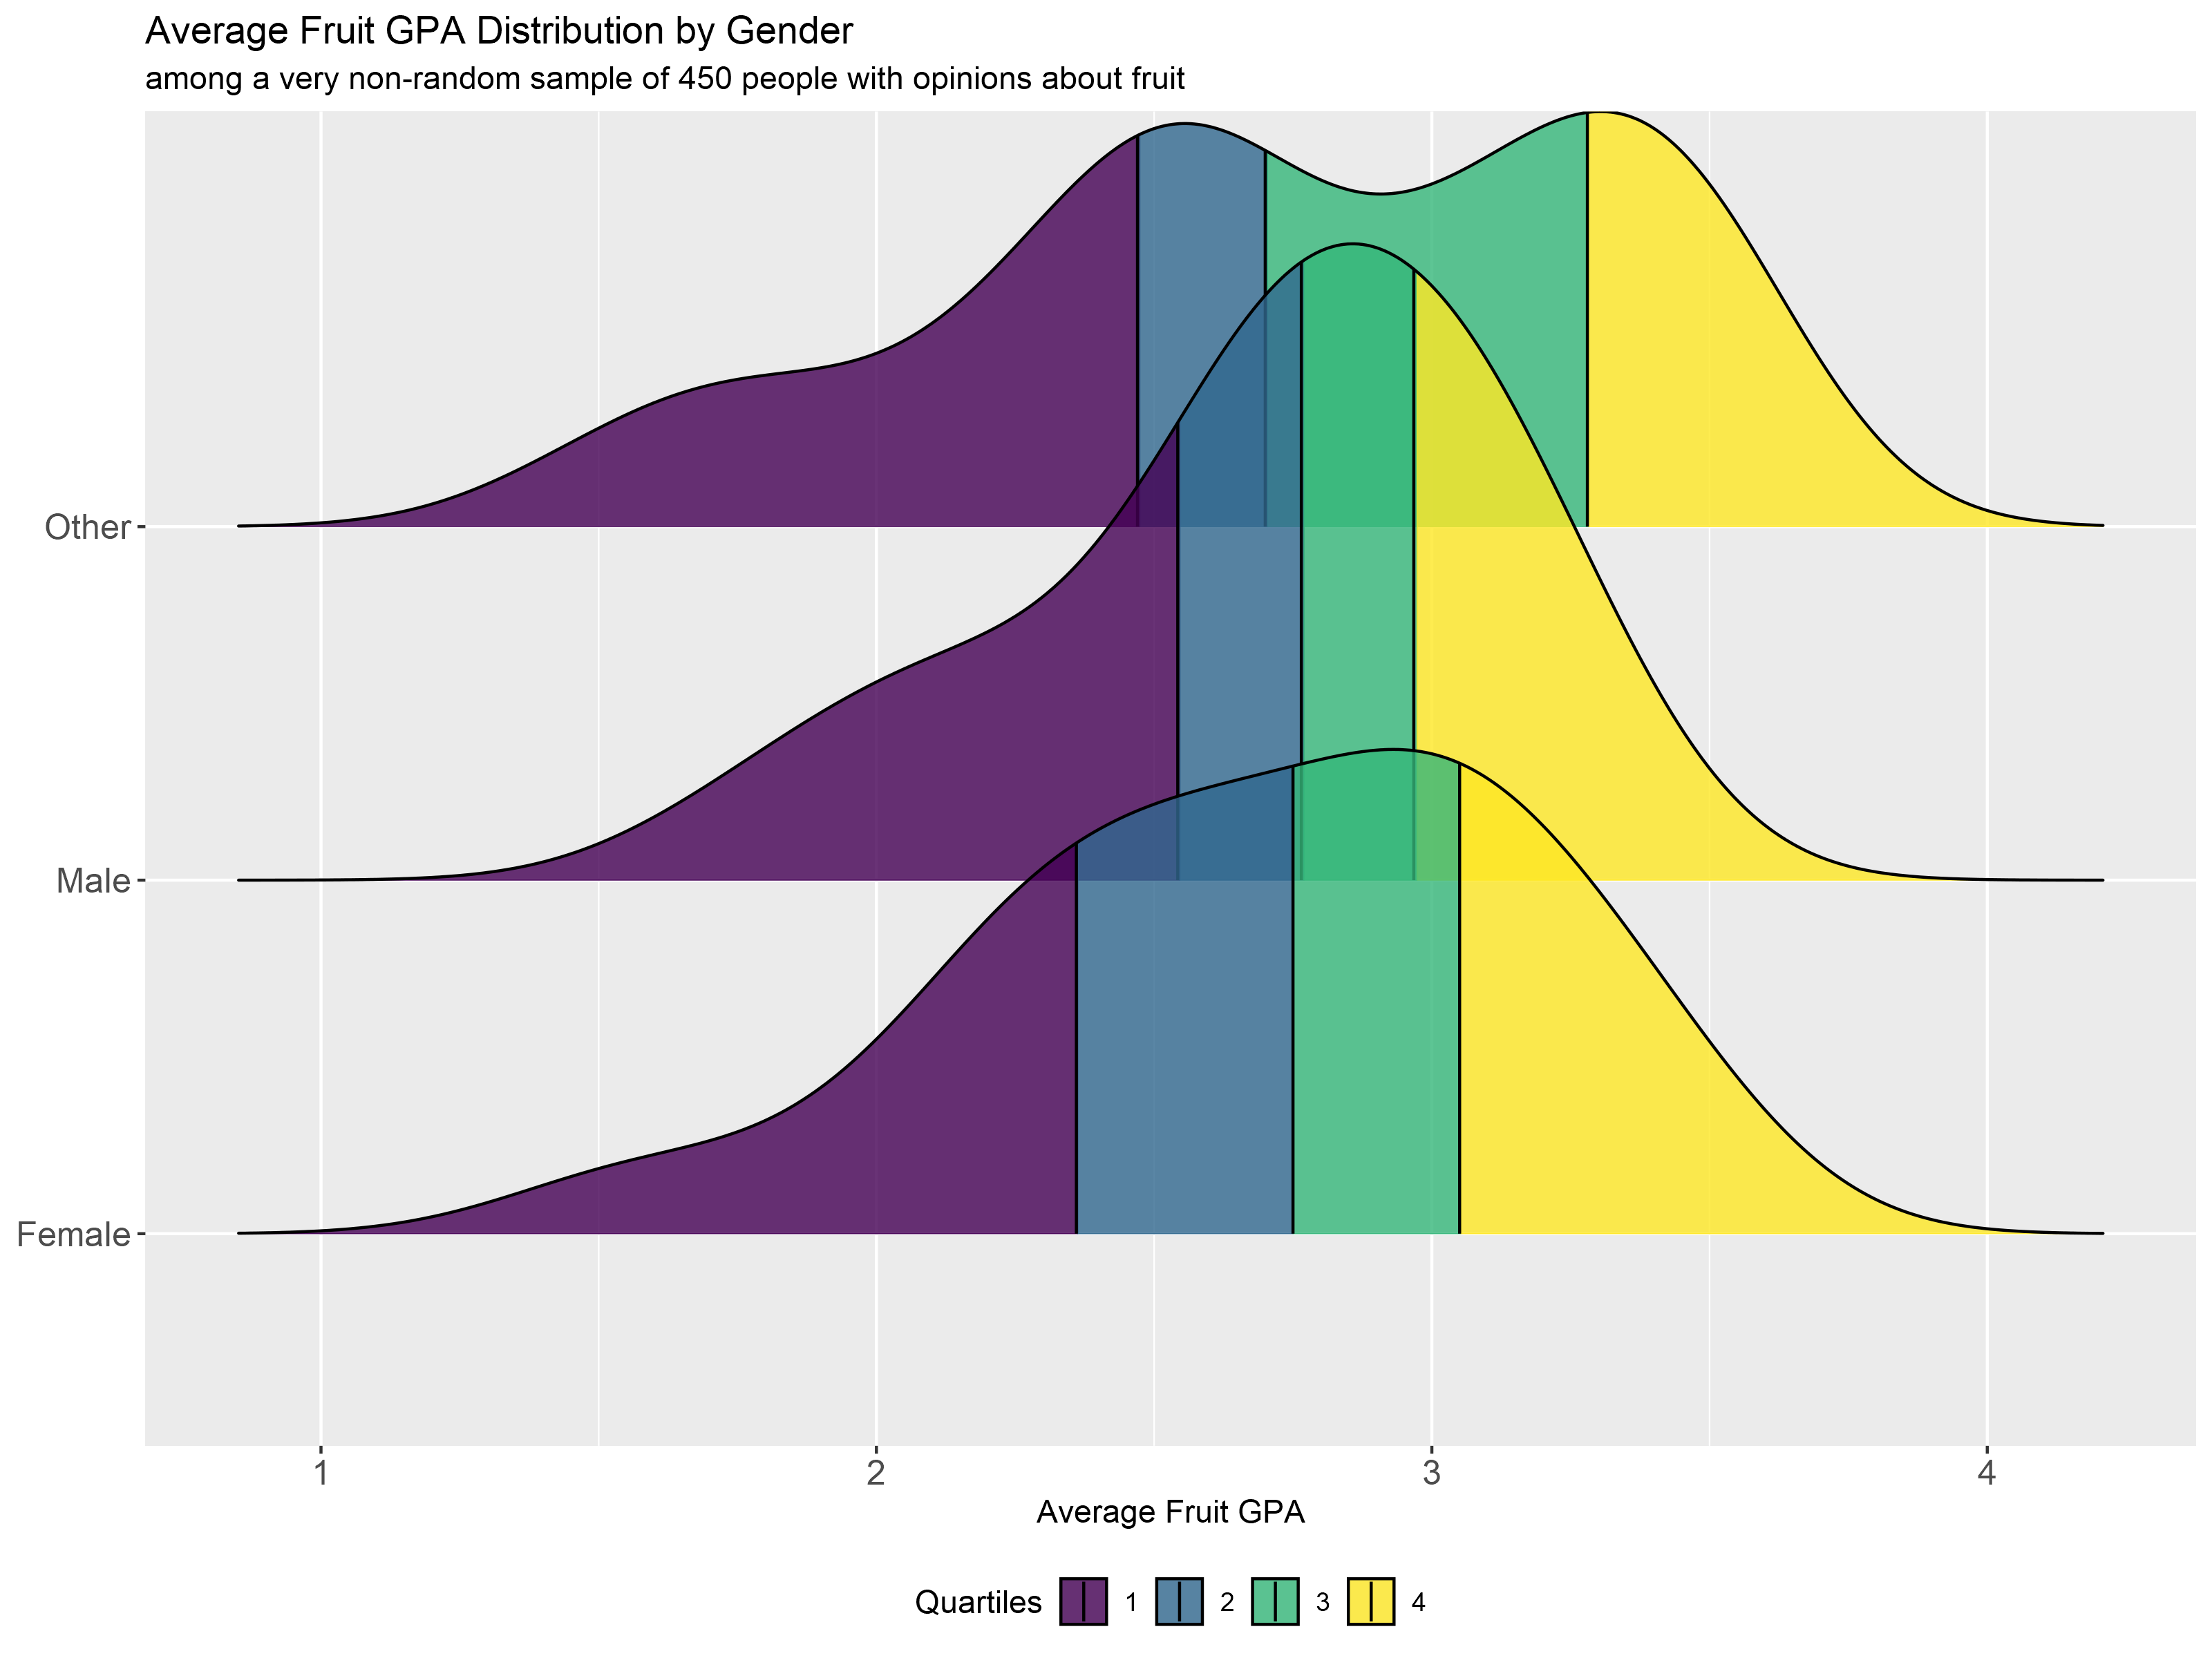
While the average rating of fruit between men and women is relatively similar, there is a much wider distribution of ratings among women compared to men. This indicates that women are more polarized about the fruit they like/don’t like, while men are more middle of the road, rating each one close to the overall average. The plot below shows the distribution of the average rating of each fruit along with quartile ranges by gender.
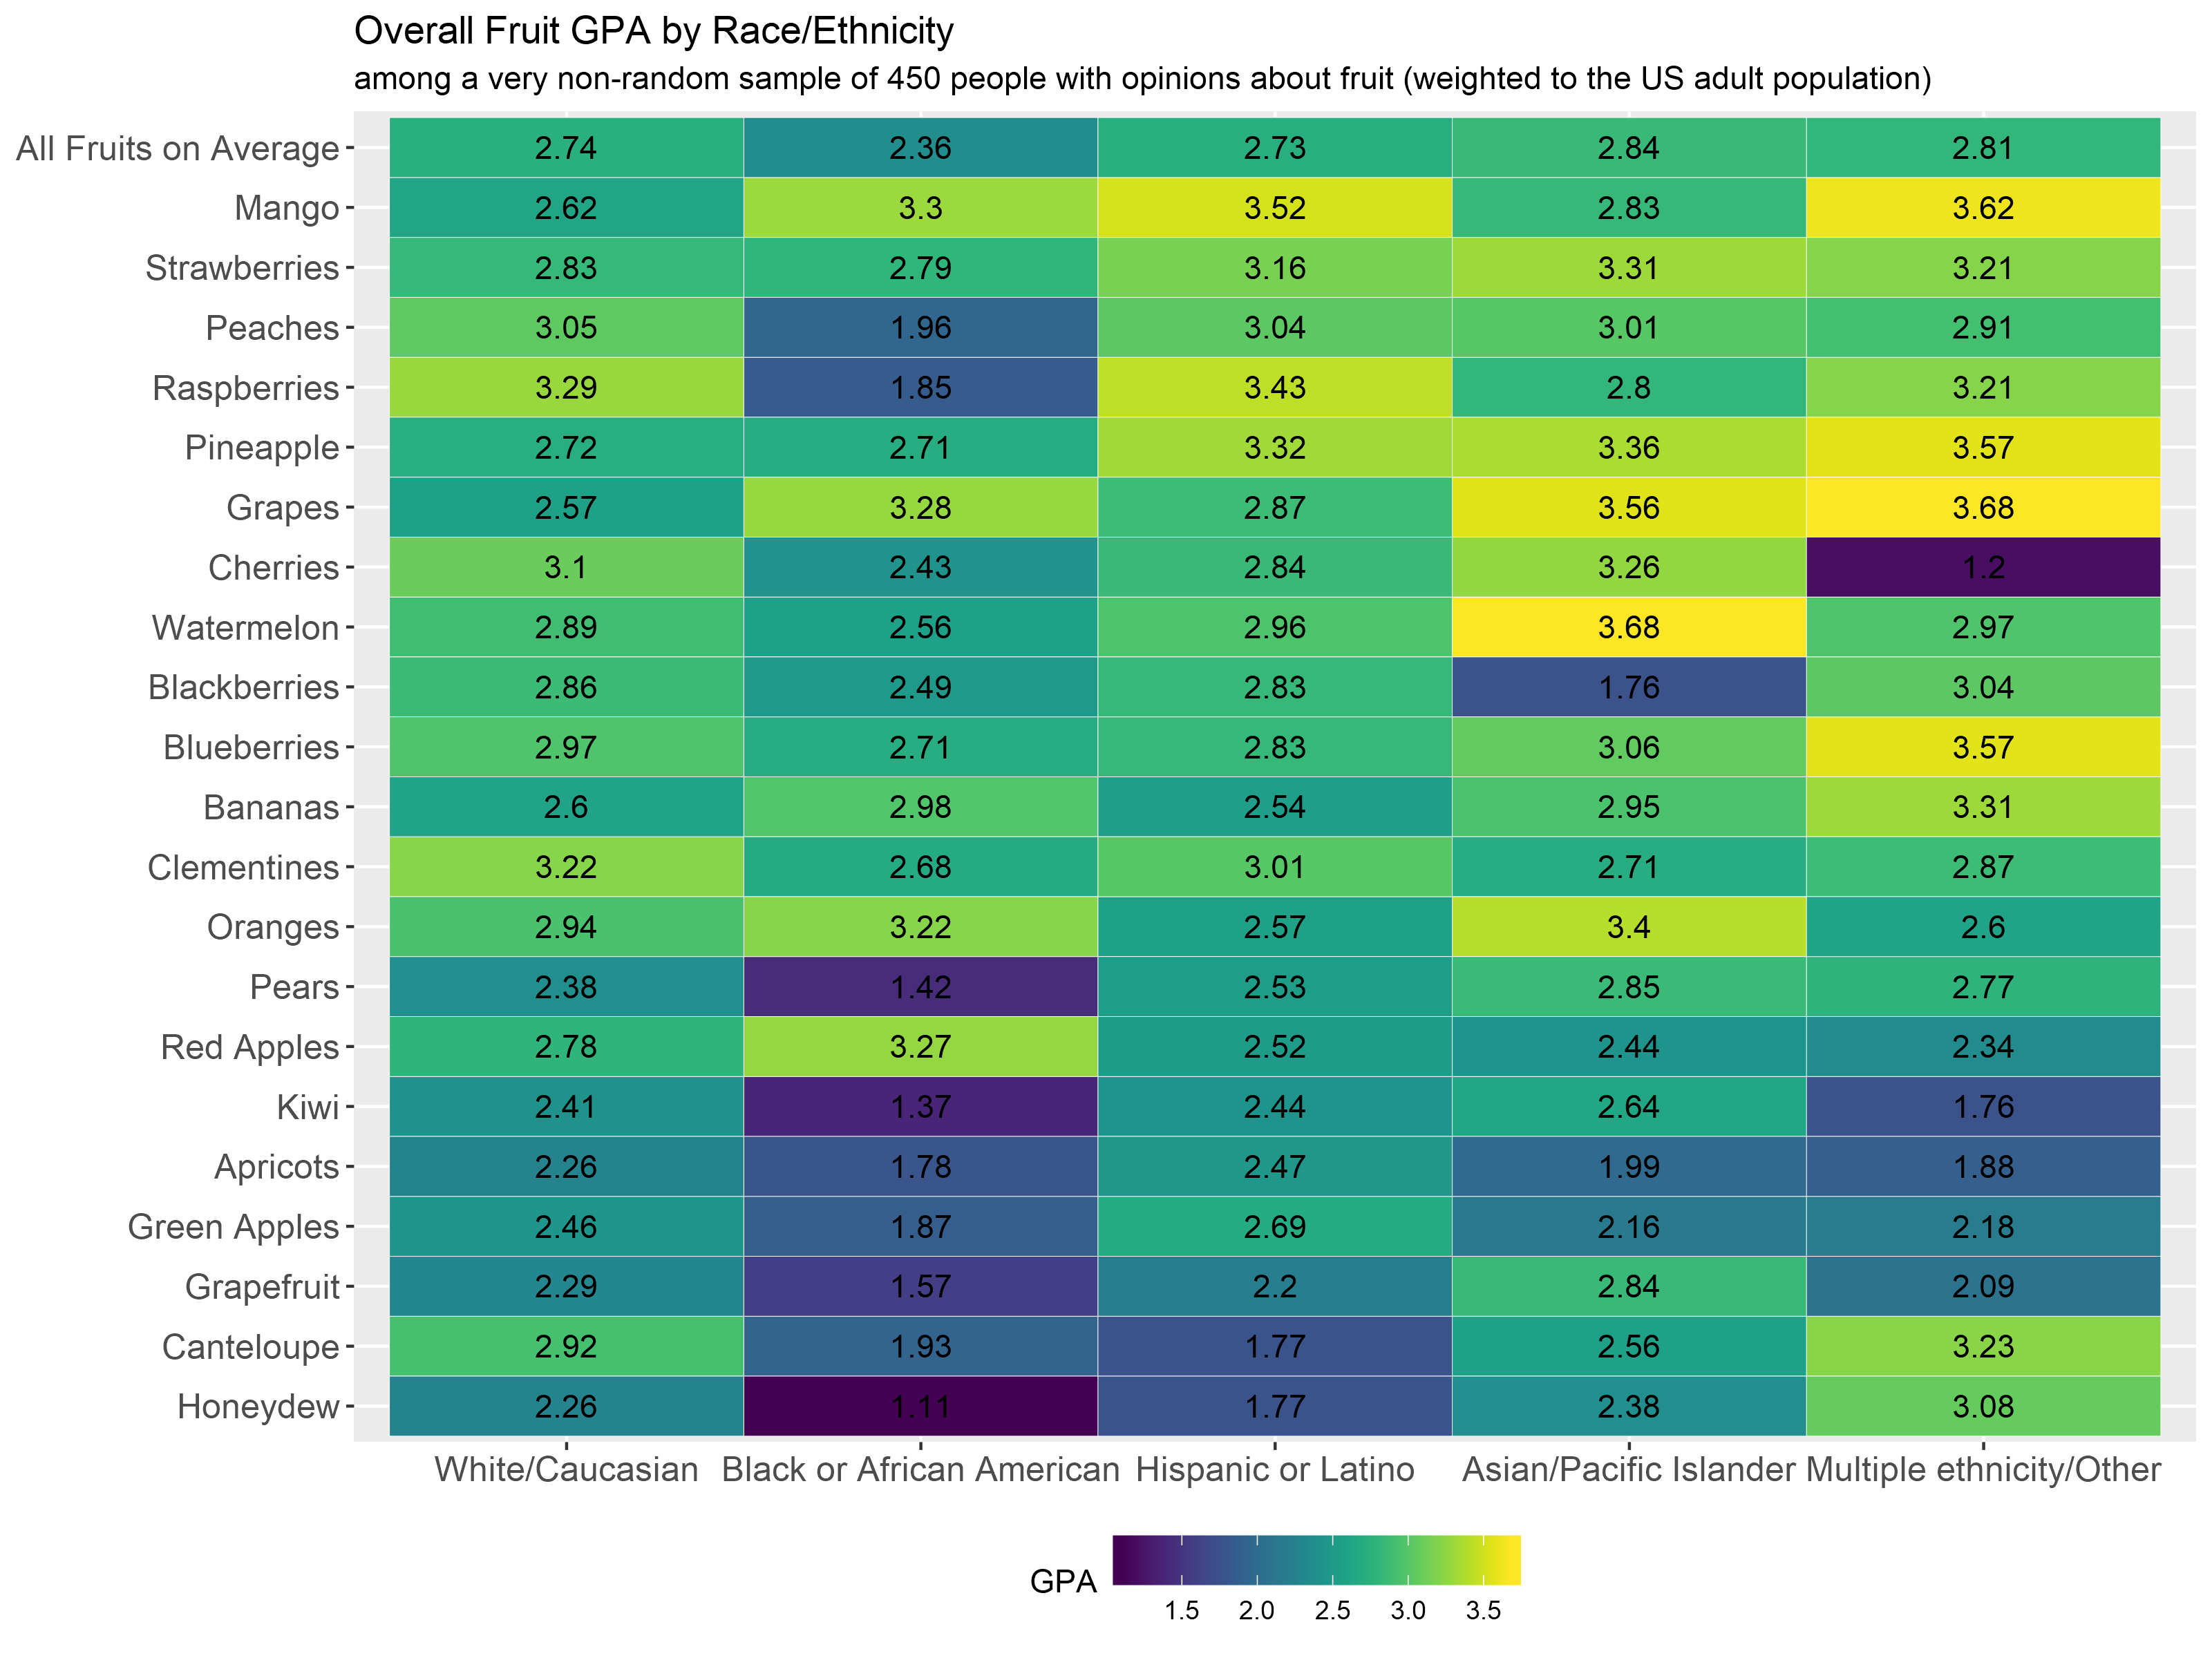
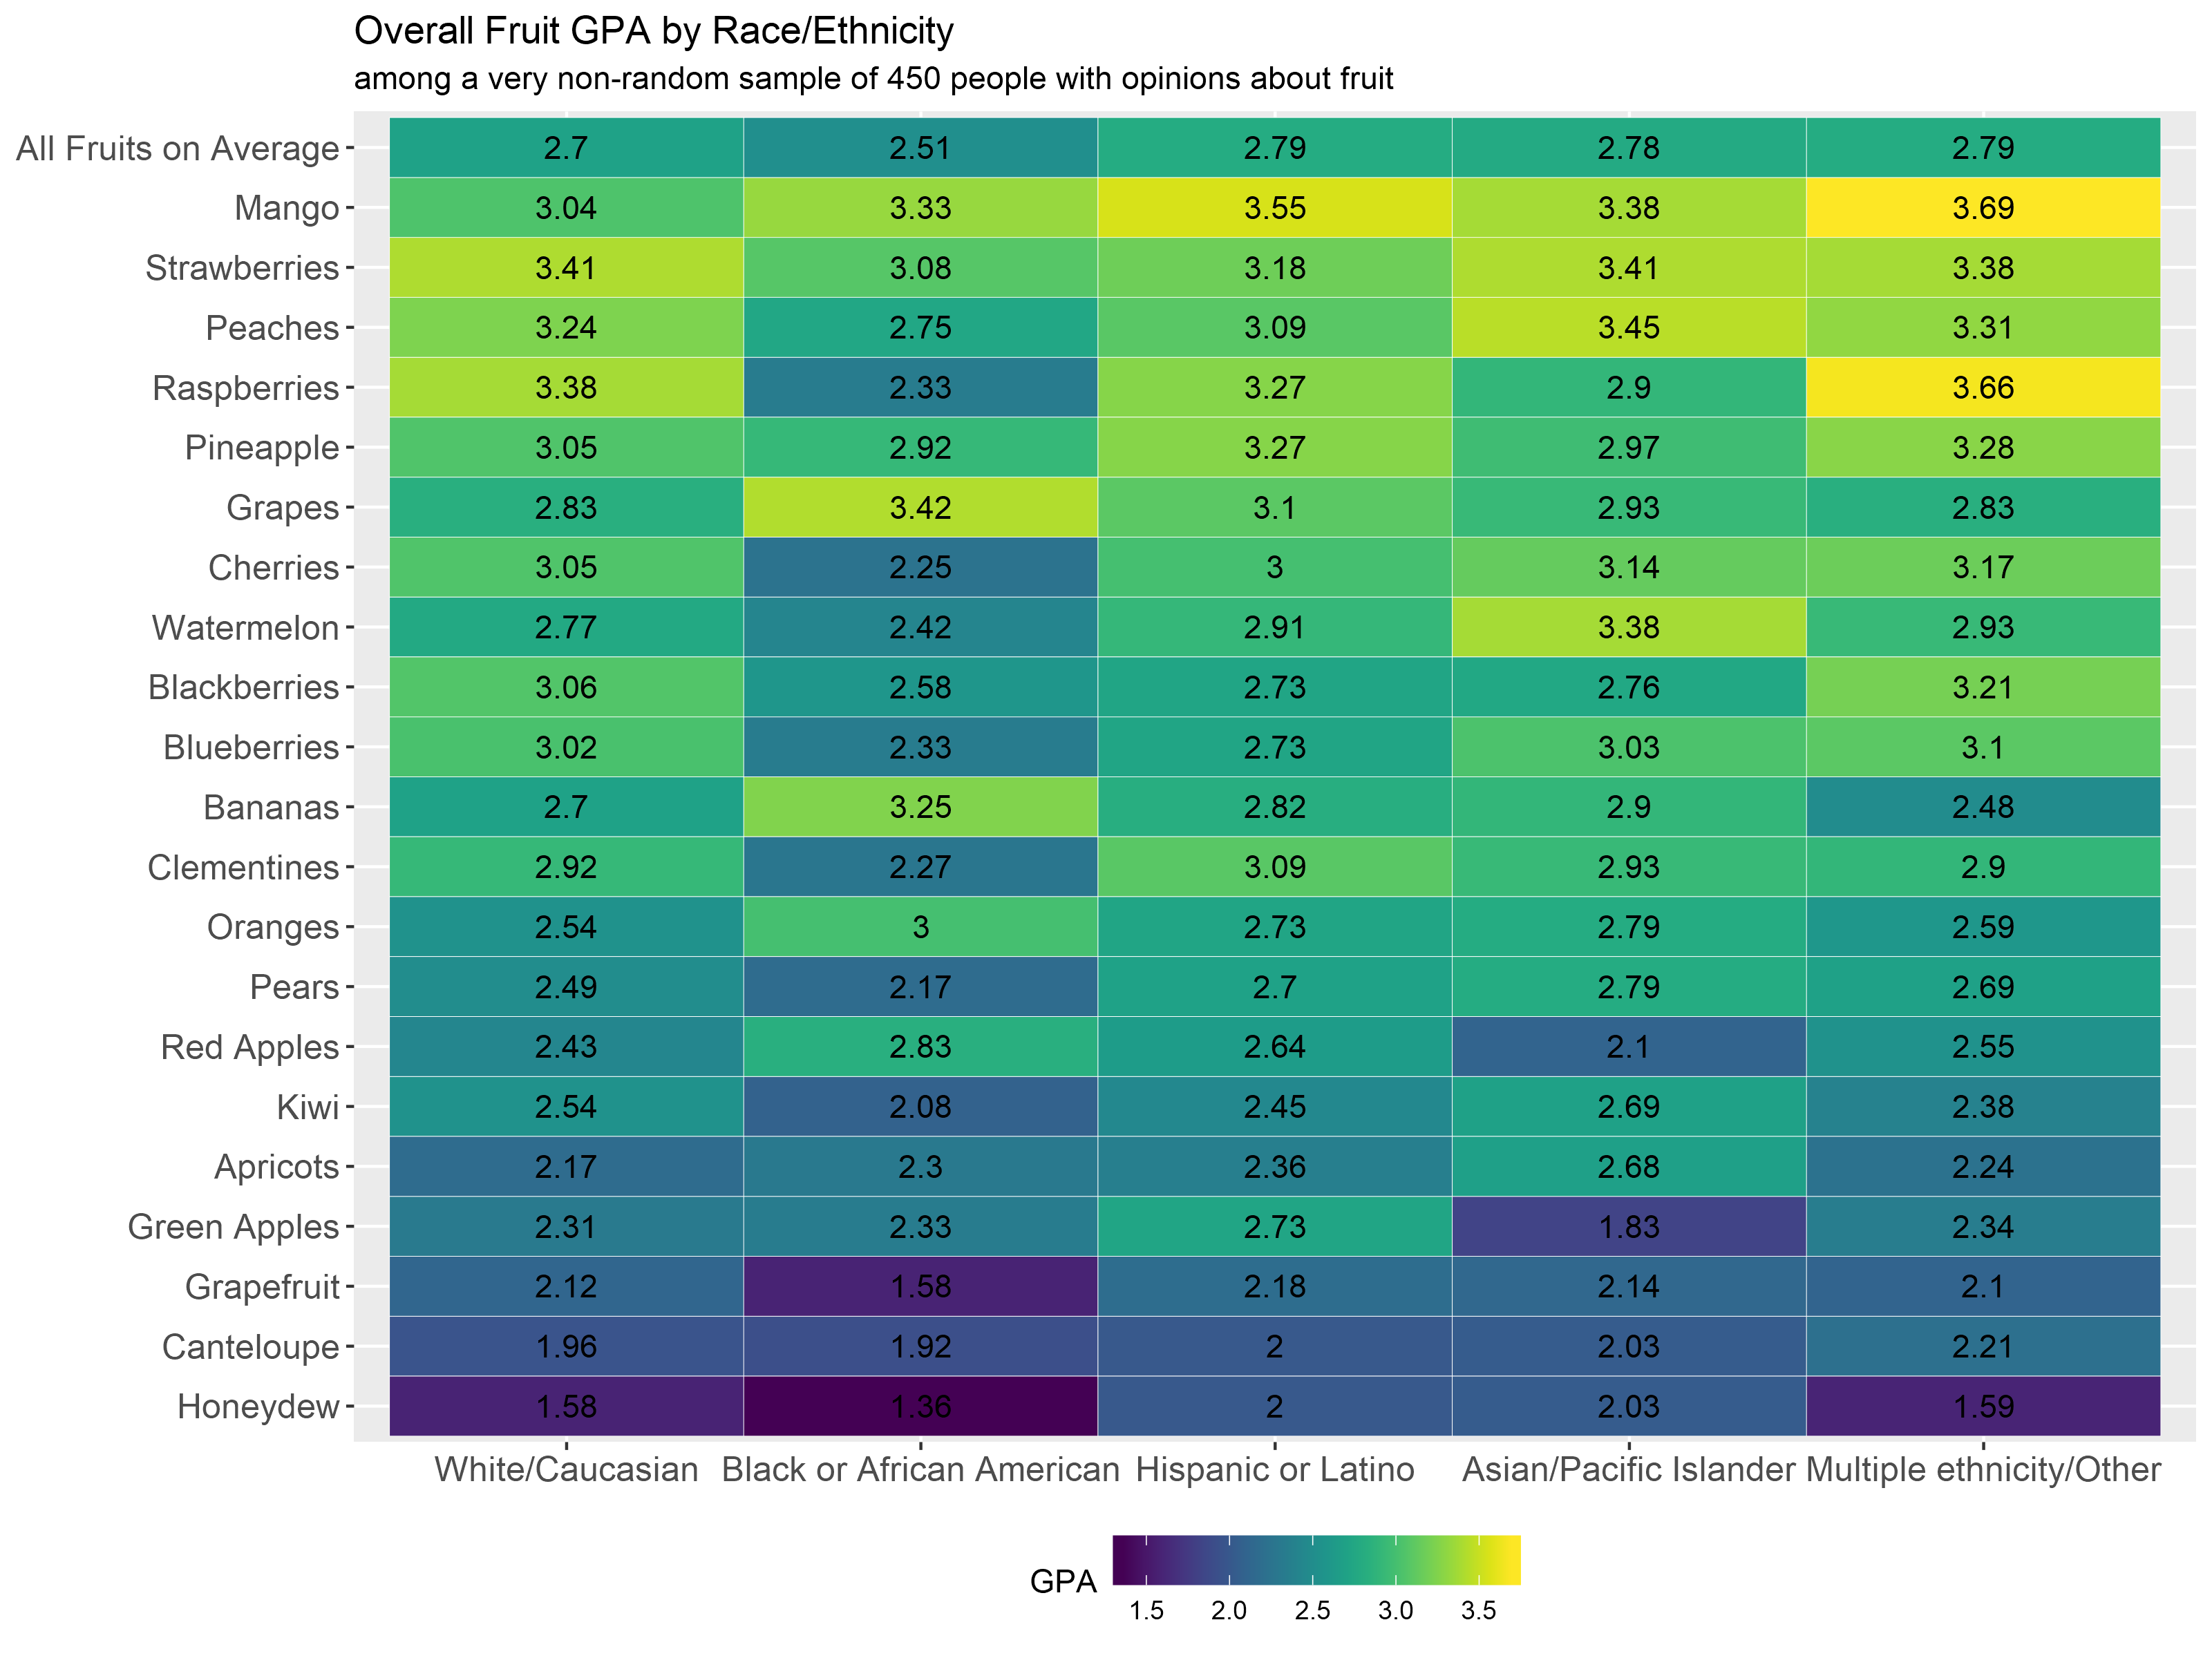
There are some interesting variations in opinion towards fruit among racial lines. For example, white respondents seem to like clementines more than black respondents, however black respondents ranked oranges more favorably than white respondents. However, neither racial group seems to like clementines as much the Hispanic/Latino survey participants.
There is also a sizable gap in views towards raspberries between black and white respondents. Fitting the data to a logistic regression reveals that black respondents are 80% less likely to rate raspberries favorably compared to white respondents, controlling for gender, age, income, and daily fruit servings.
Watermelon and peaches are rated the most favorably among Asian respondents compared to other races.
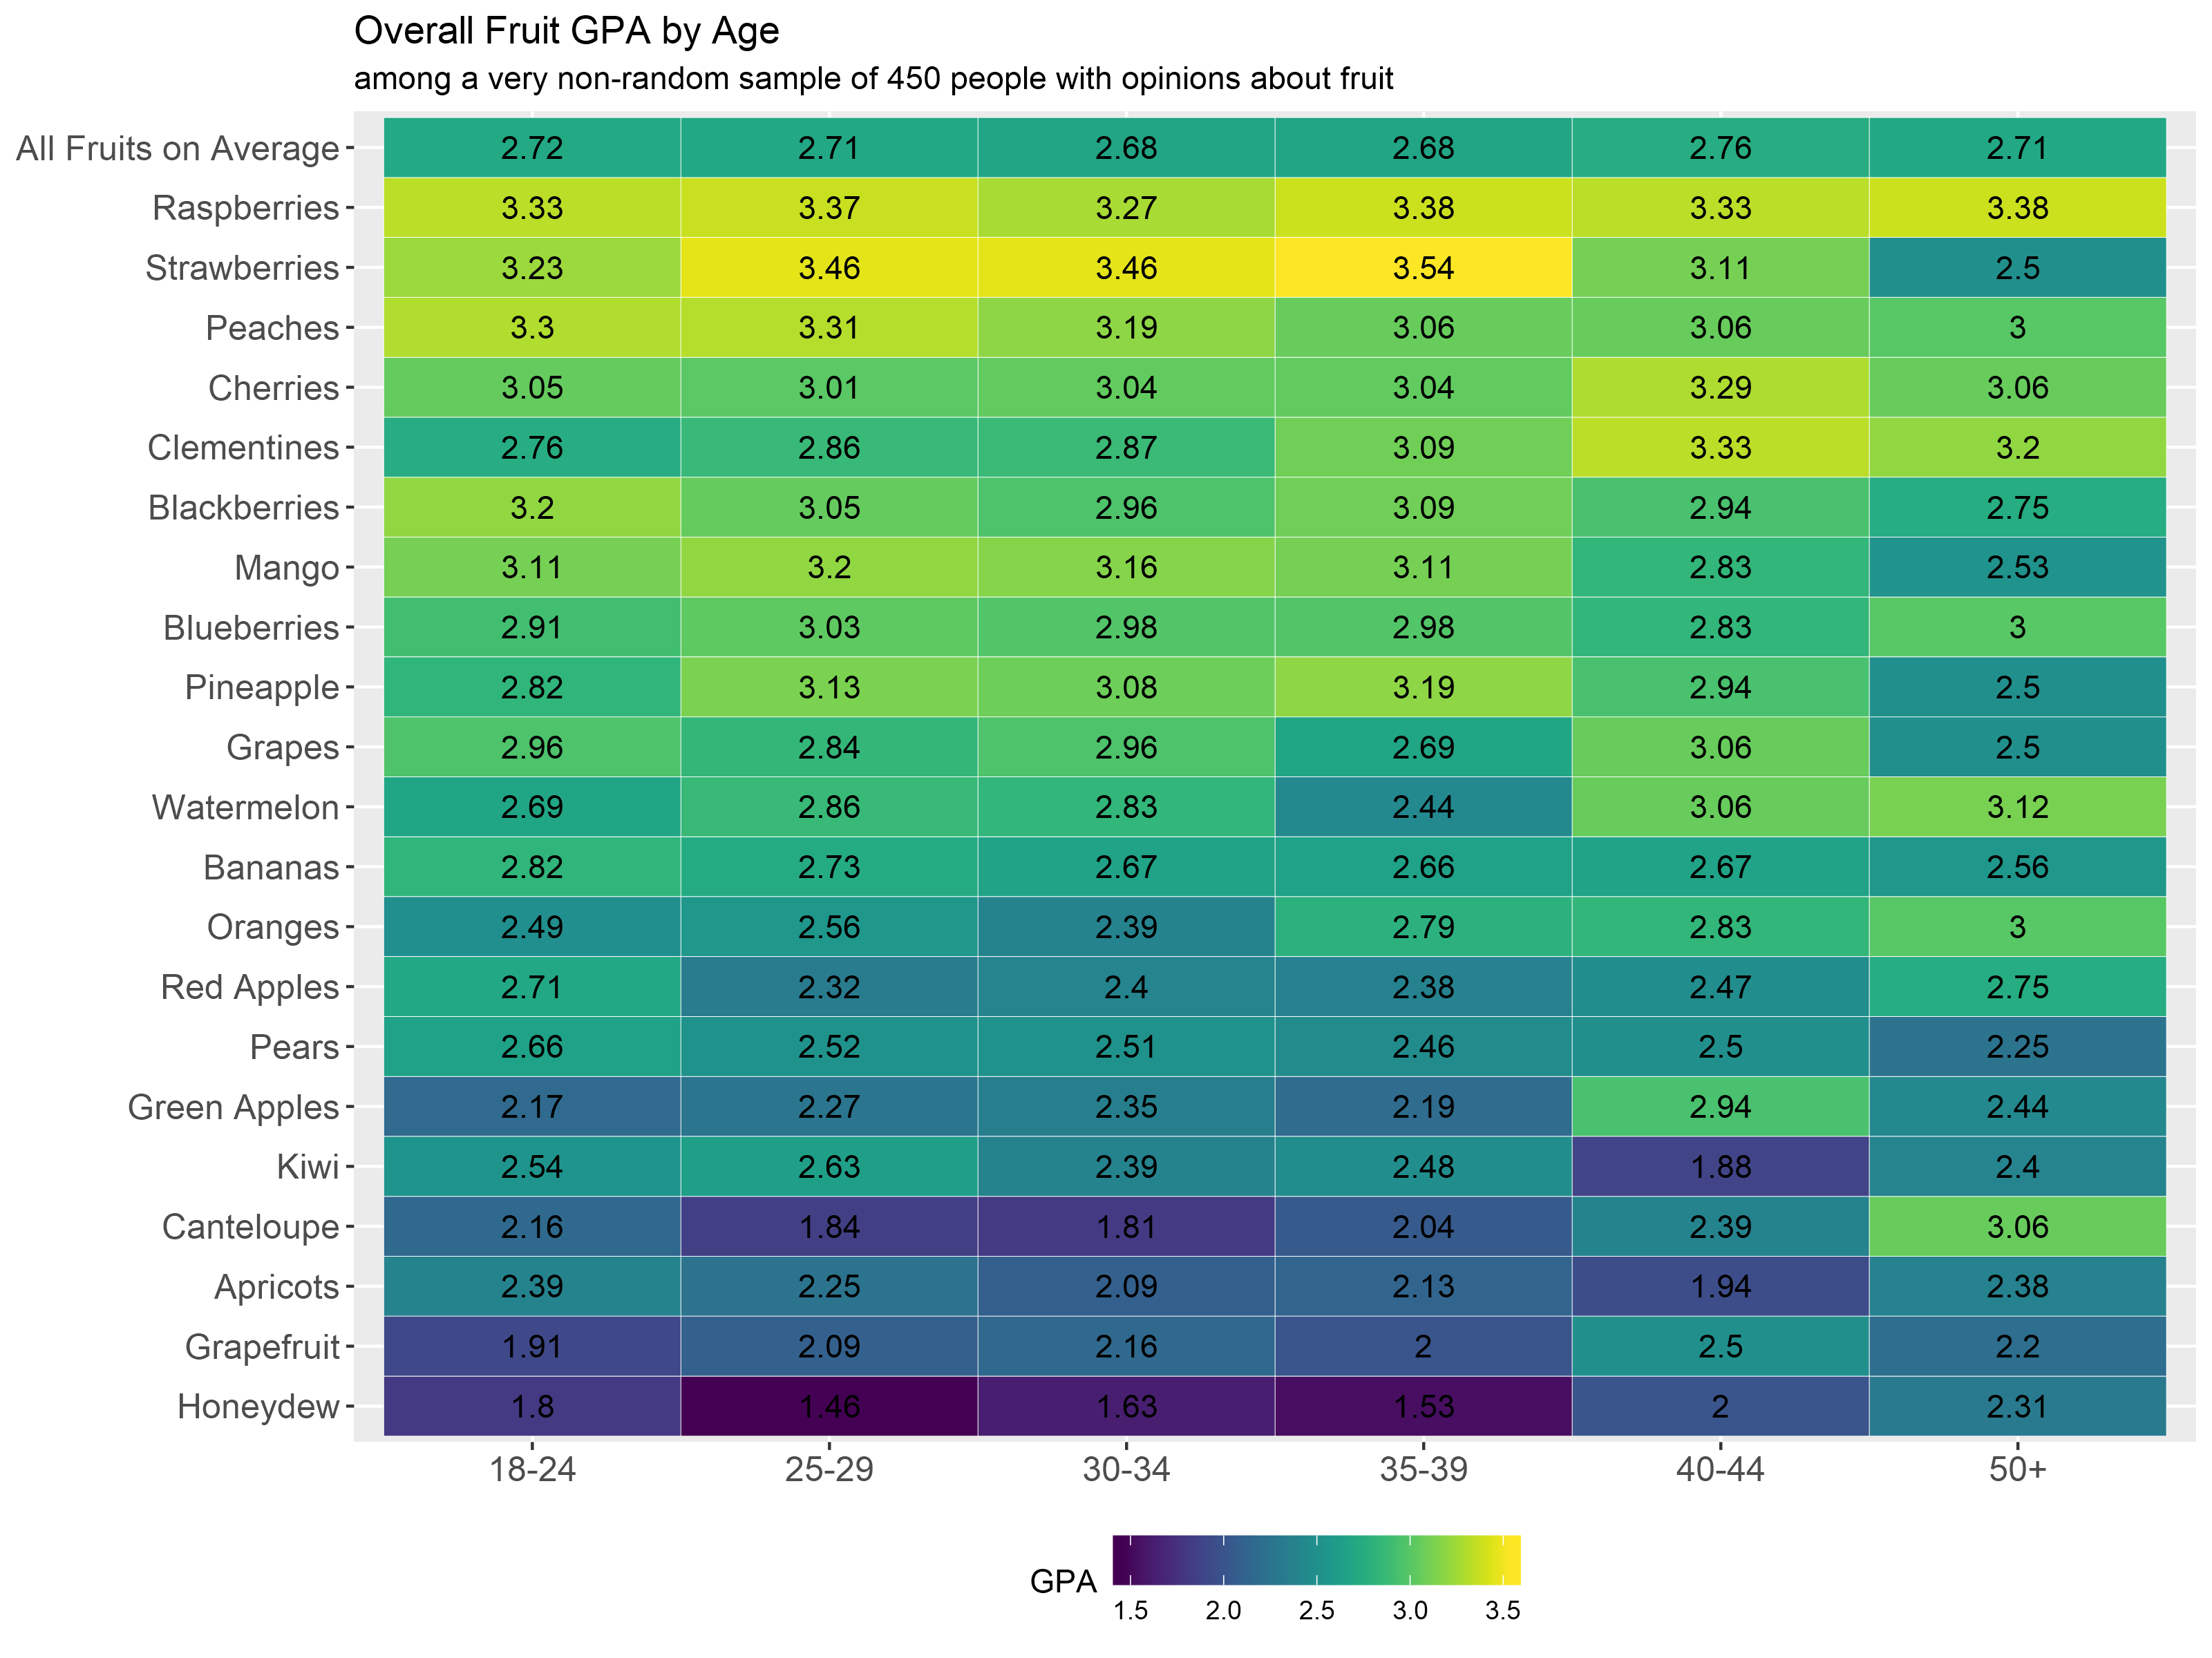
At face-value, age appears to be a driving factor in attitudes towards fruits. Survey respondents over the age of 50 actually rated cantaloupe above the 3.0 threshold, while younger respondents put it just above and below the 2.0 threshold. Add that to the ever growing list of things that Millennials are killing. Respondents over 50 also rated strawberries, the people’s champion of this survey, and Mango as 2.5 fruits.
In general there appears to be much more of an intensity/polarization among younger age groups (25-39) towards specific fruits compared to those over 50.
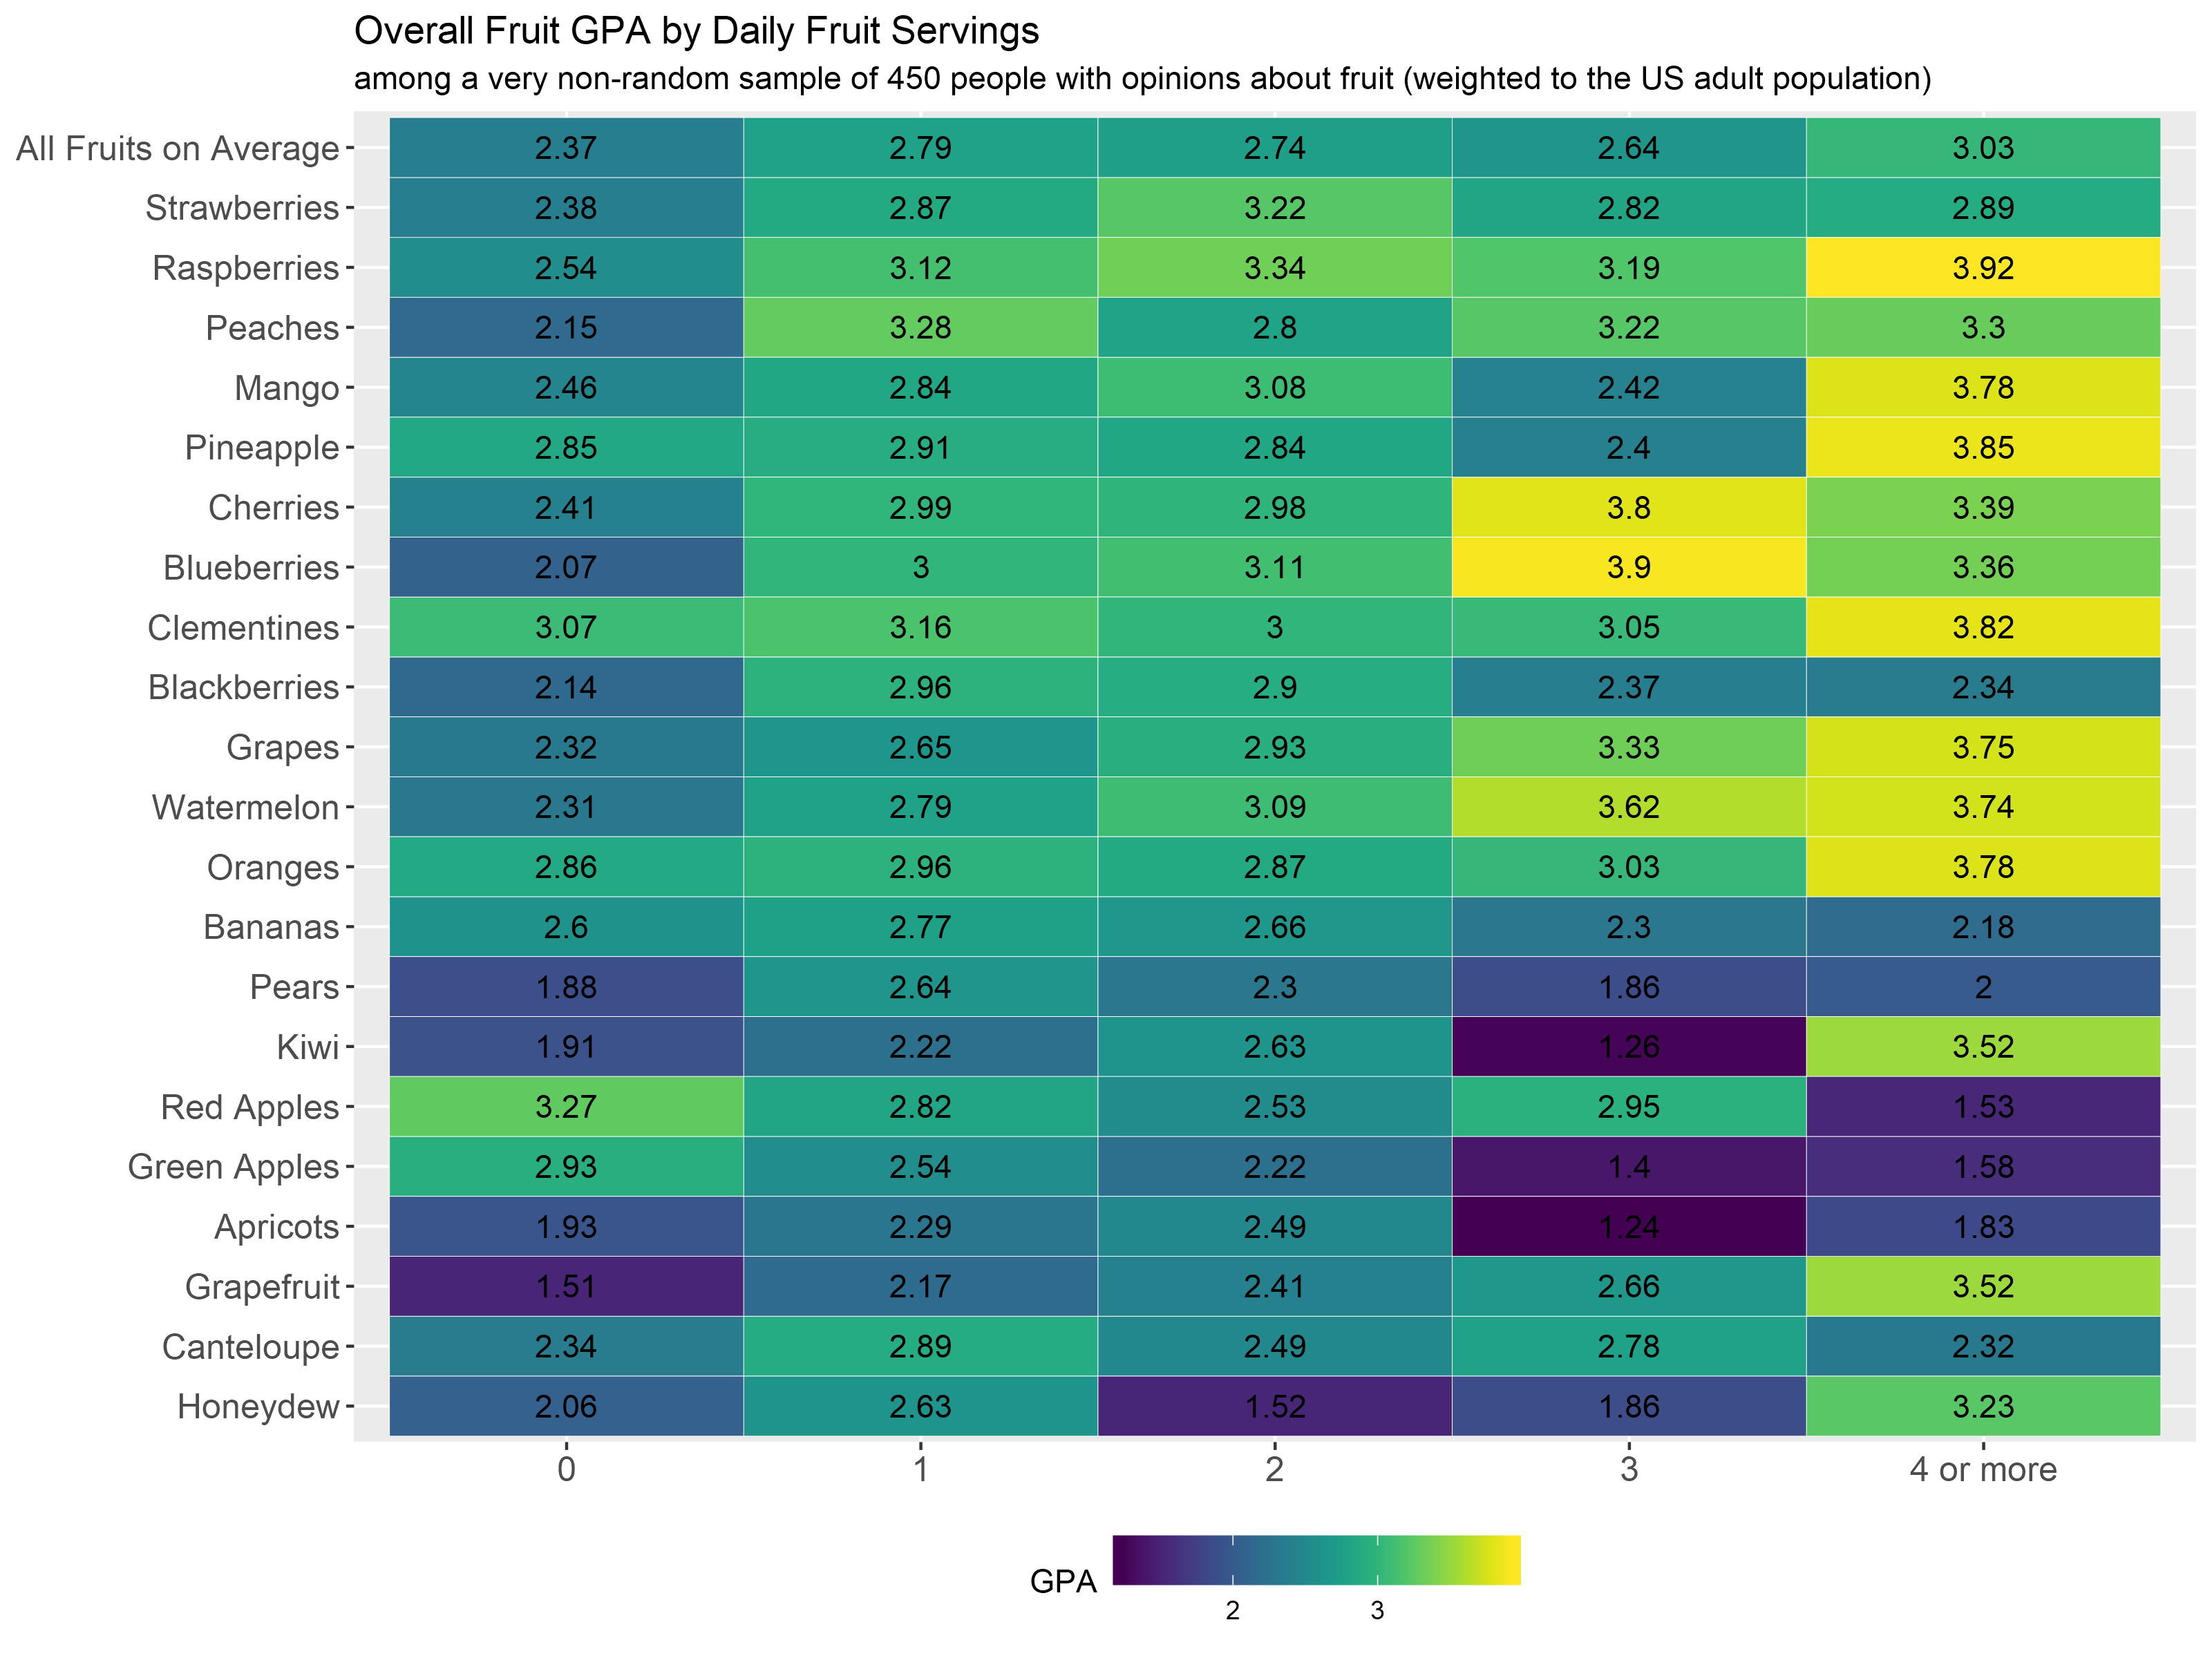
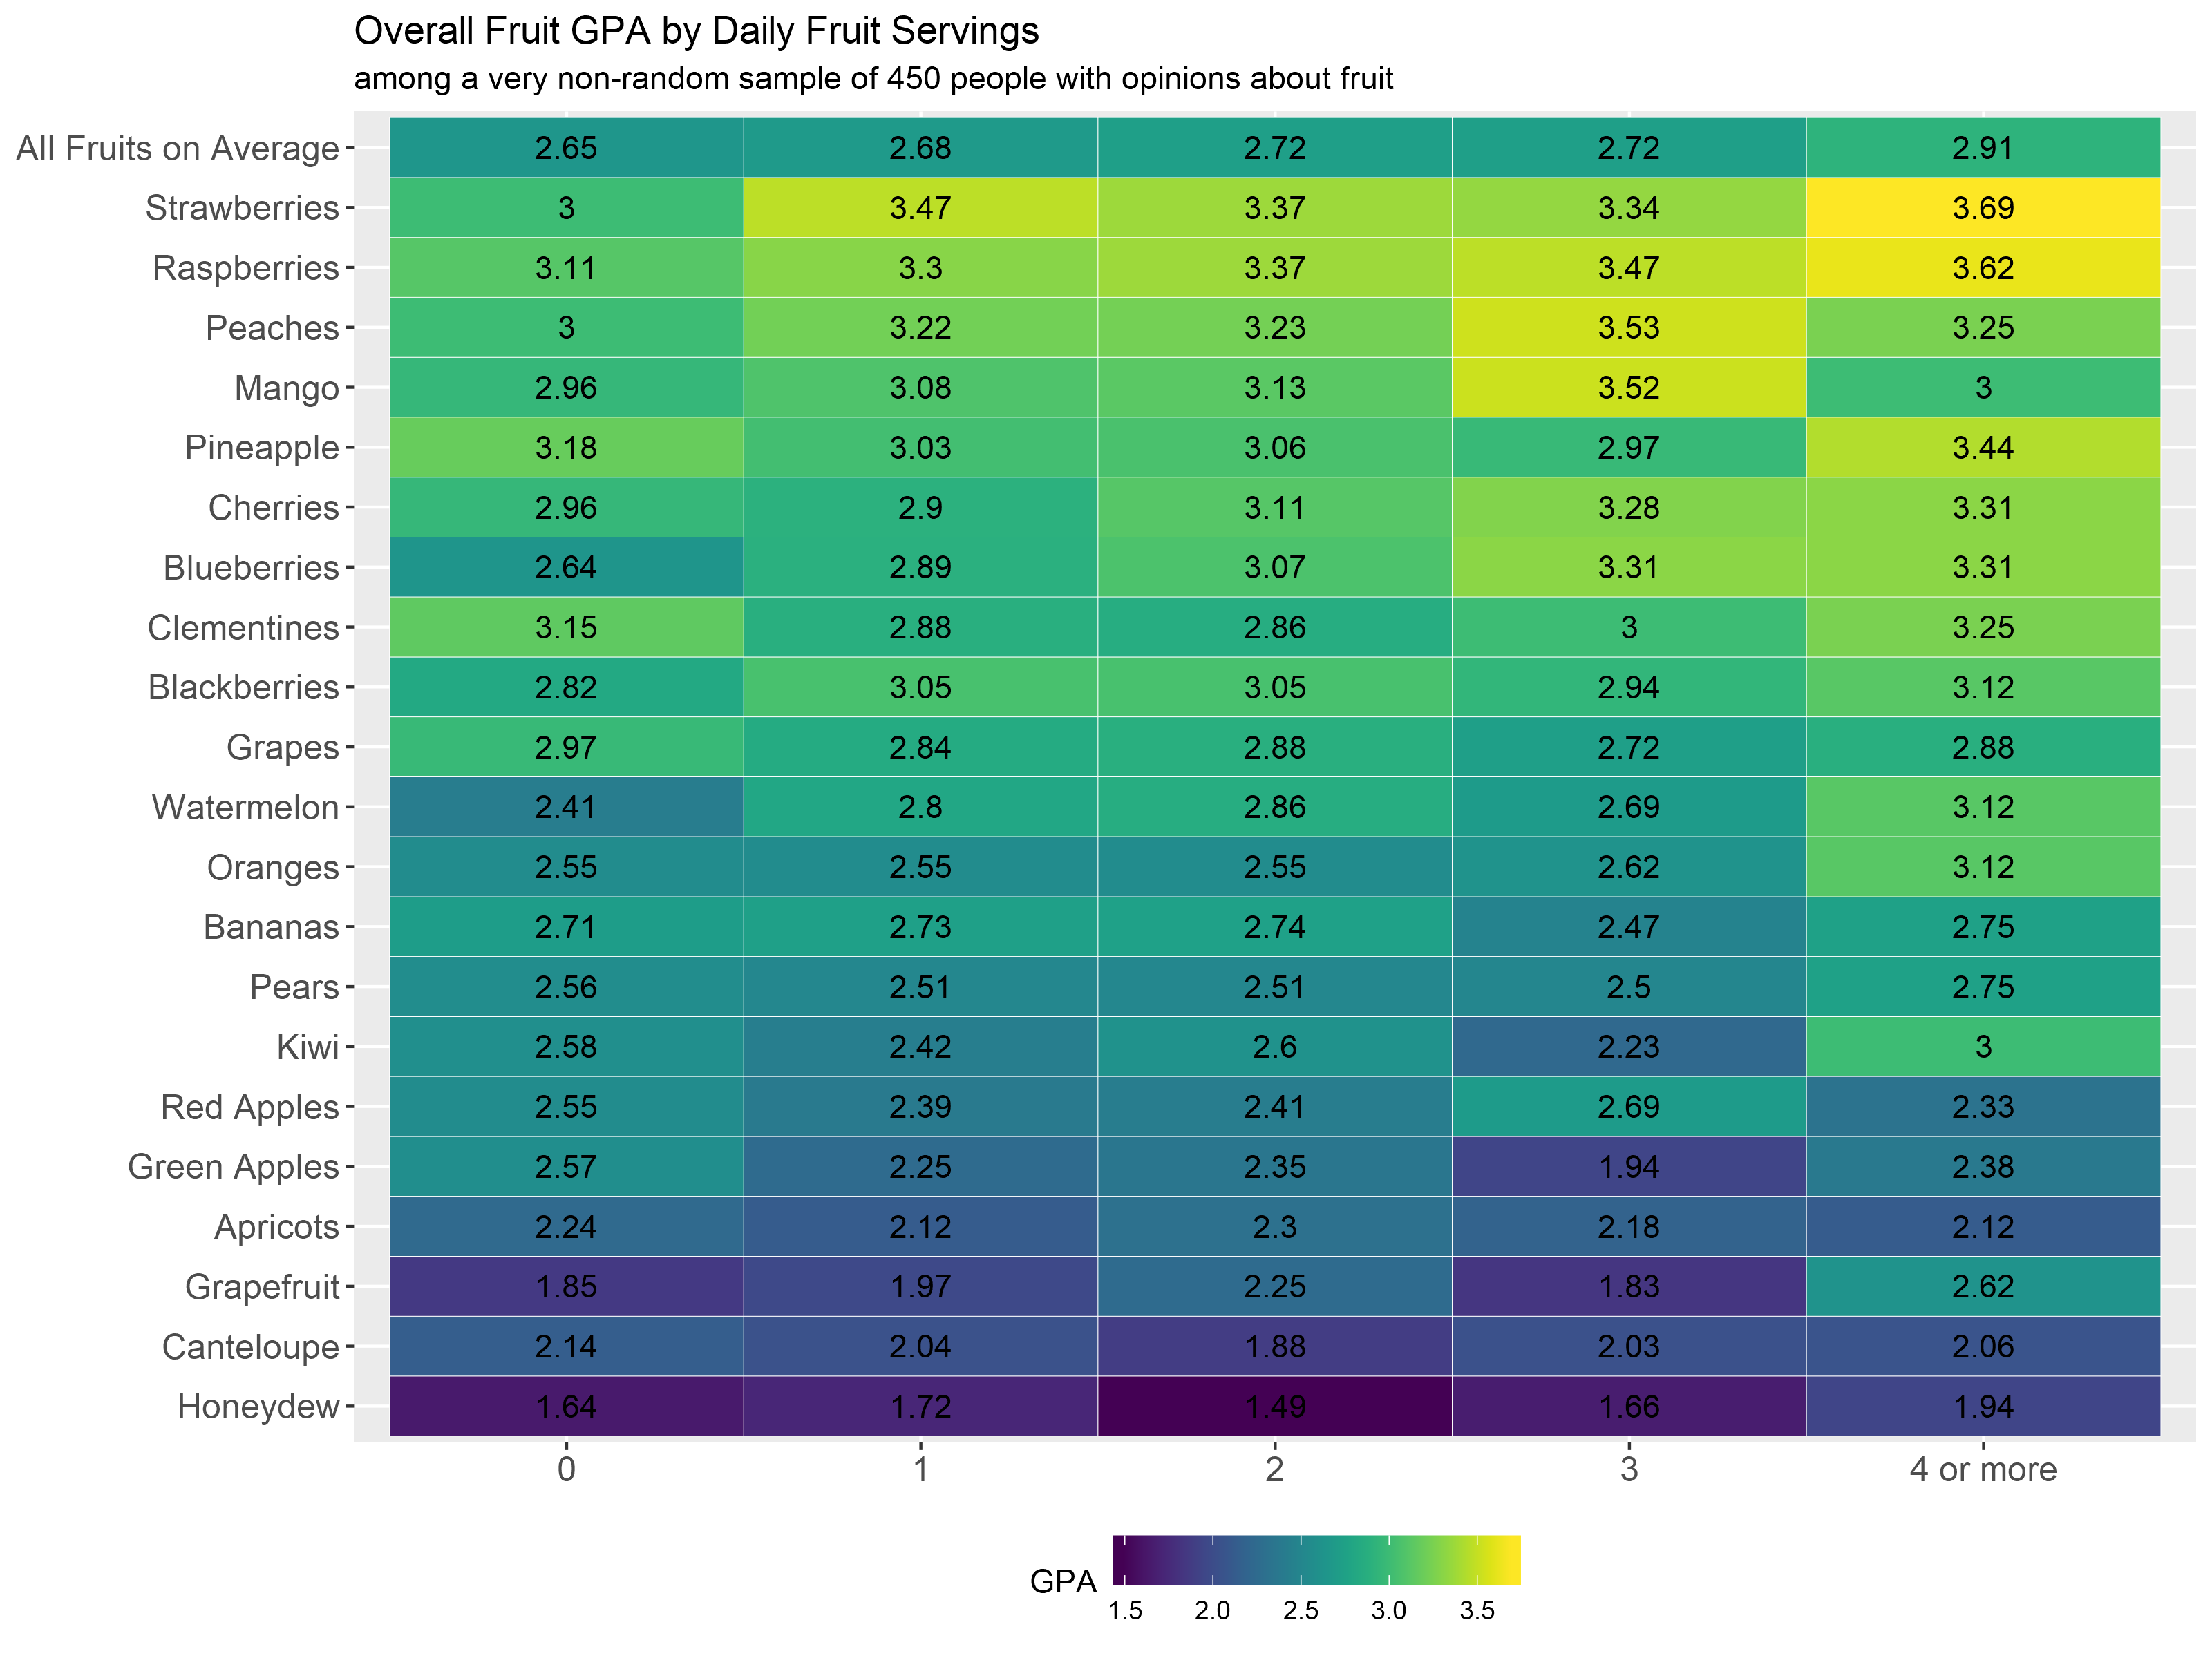
As a part of the survey, respondents were asked how many servings of fruit they eat per day on average. This question is subject to some social desirability bias, but I wanted a proxy way to measure how familiar people are with fruit.
On average, those who eat more fruit a day tend to have more favorable ratings towards fruit. Respondents who eat four or more rated all of the fruit items 2.91 on average, compared to those who eat 0 servings a day at 2.65. Notably, there is little difference in attitudes towards cantaloupe among different levels of fruit consumption. Even those who love fruit hate cantaloupe and honeydew.
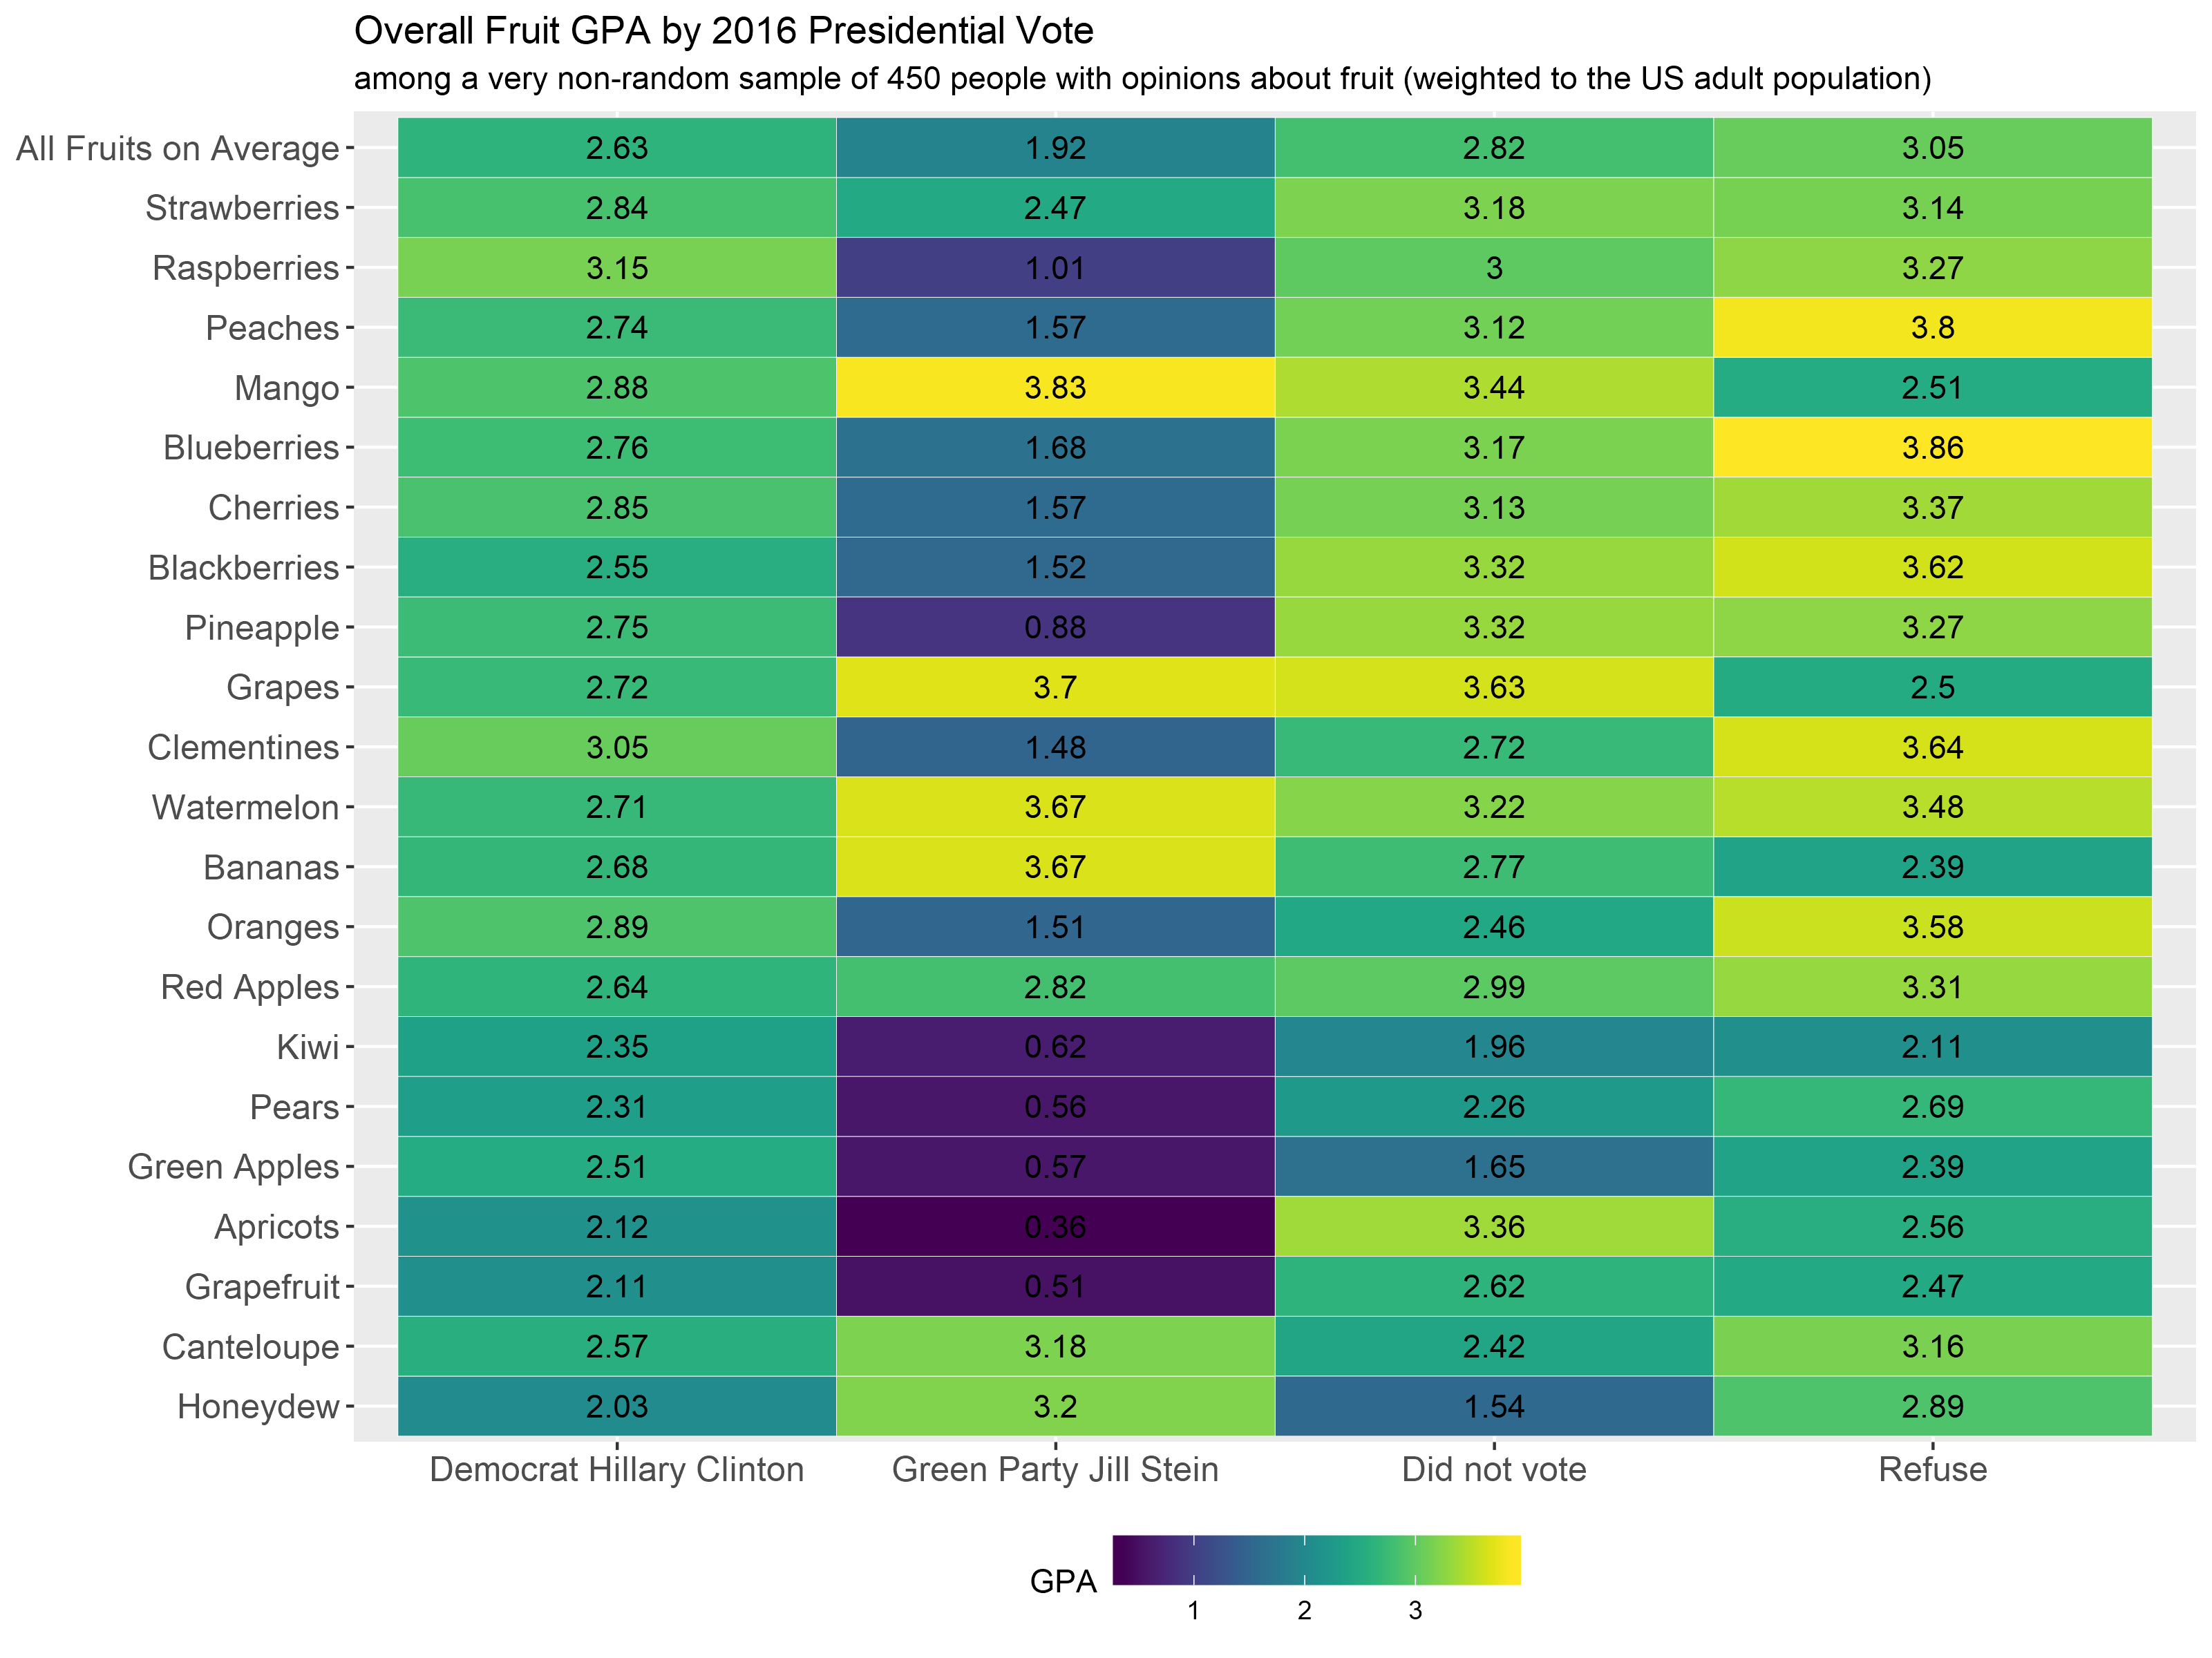
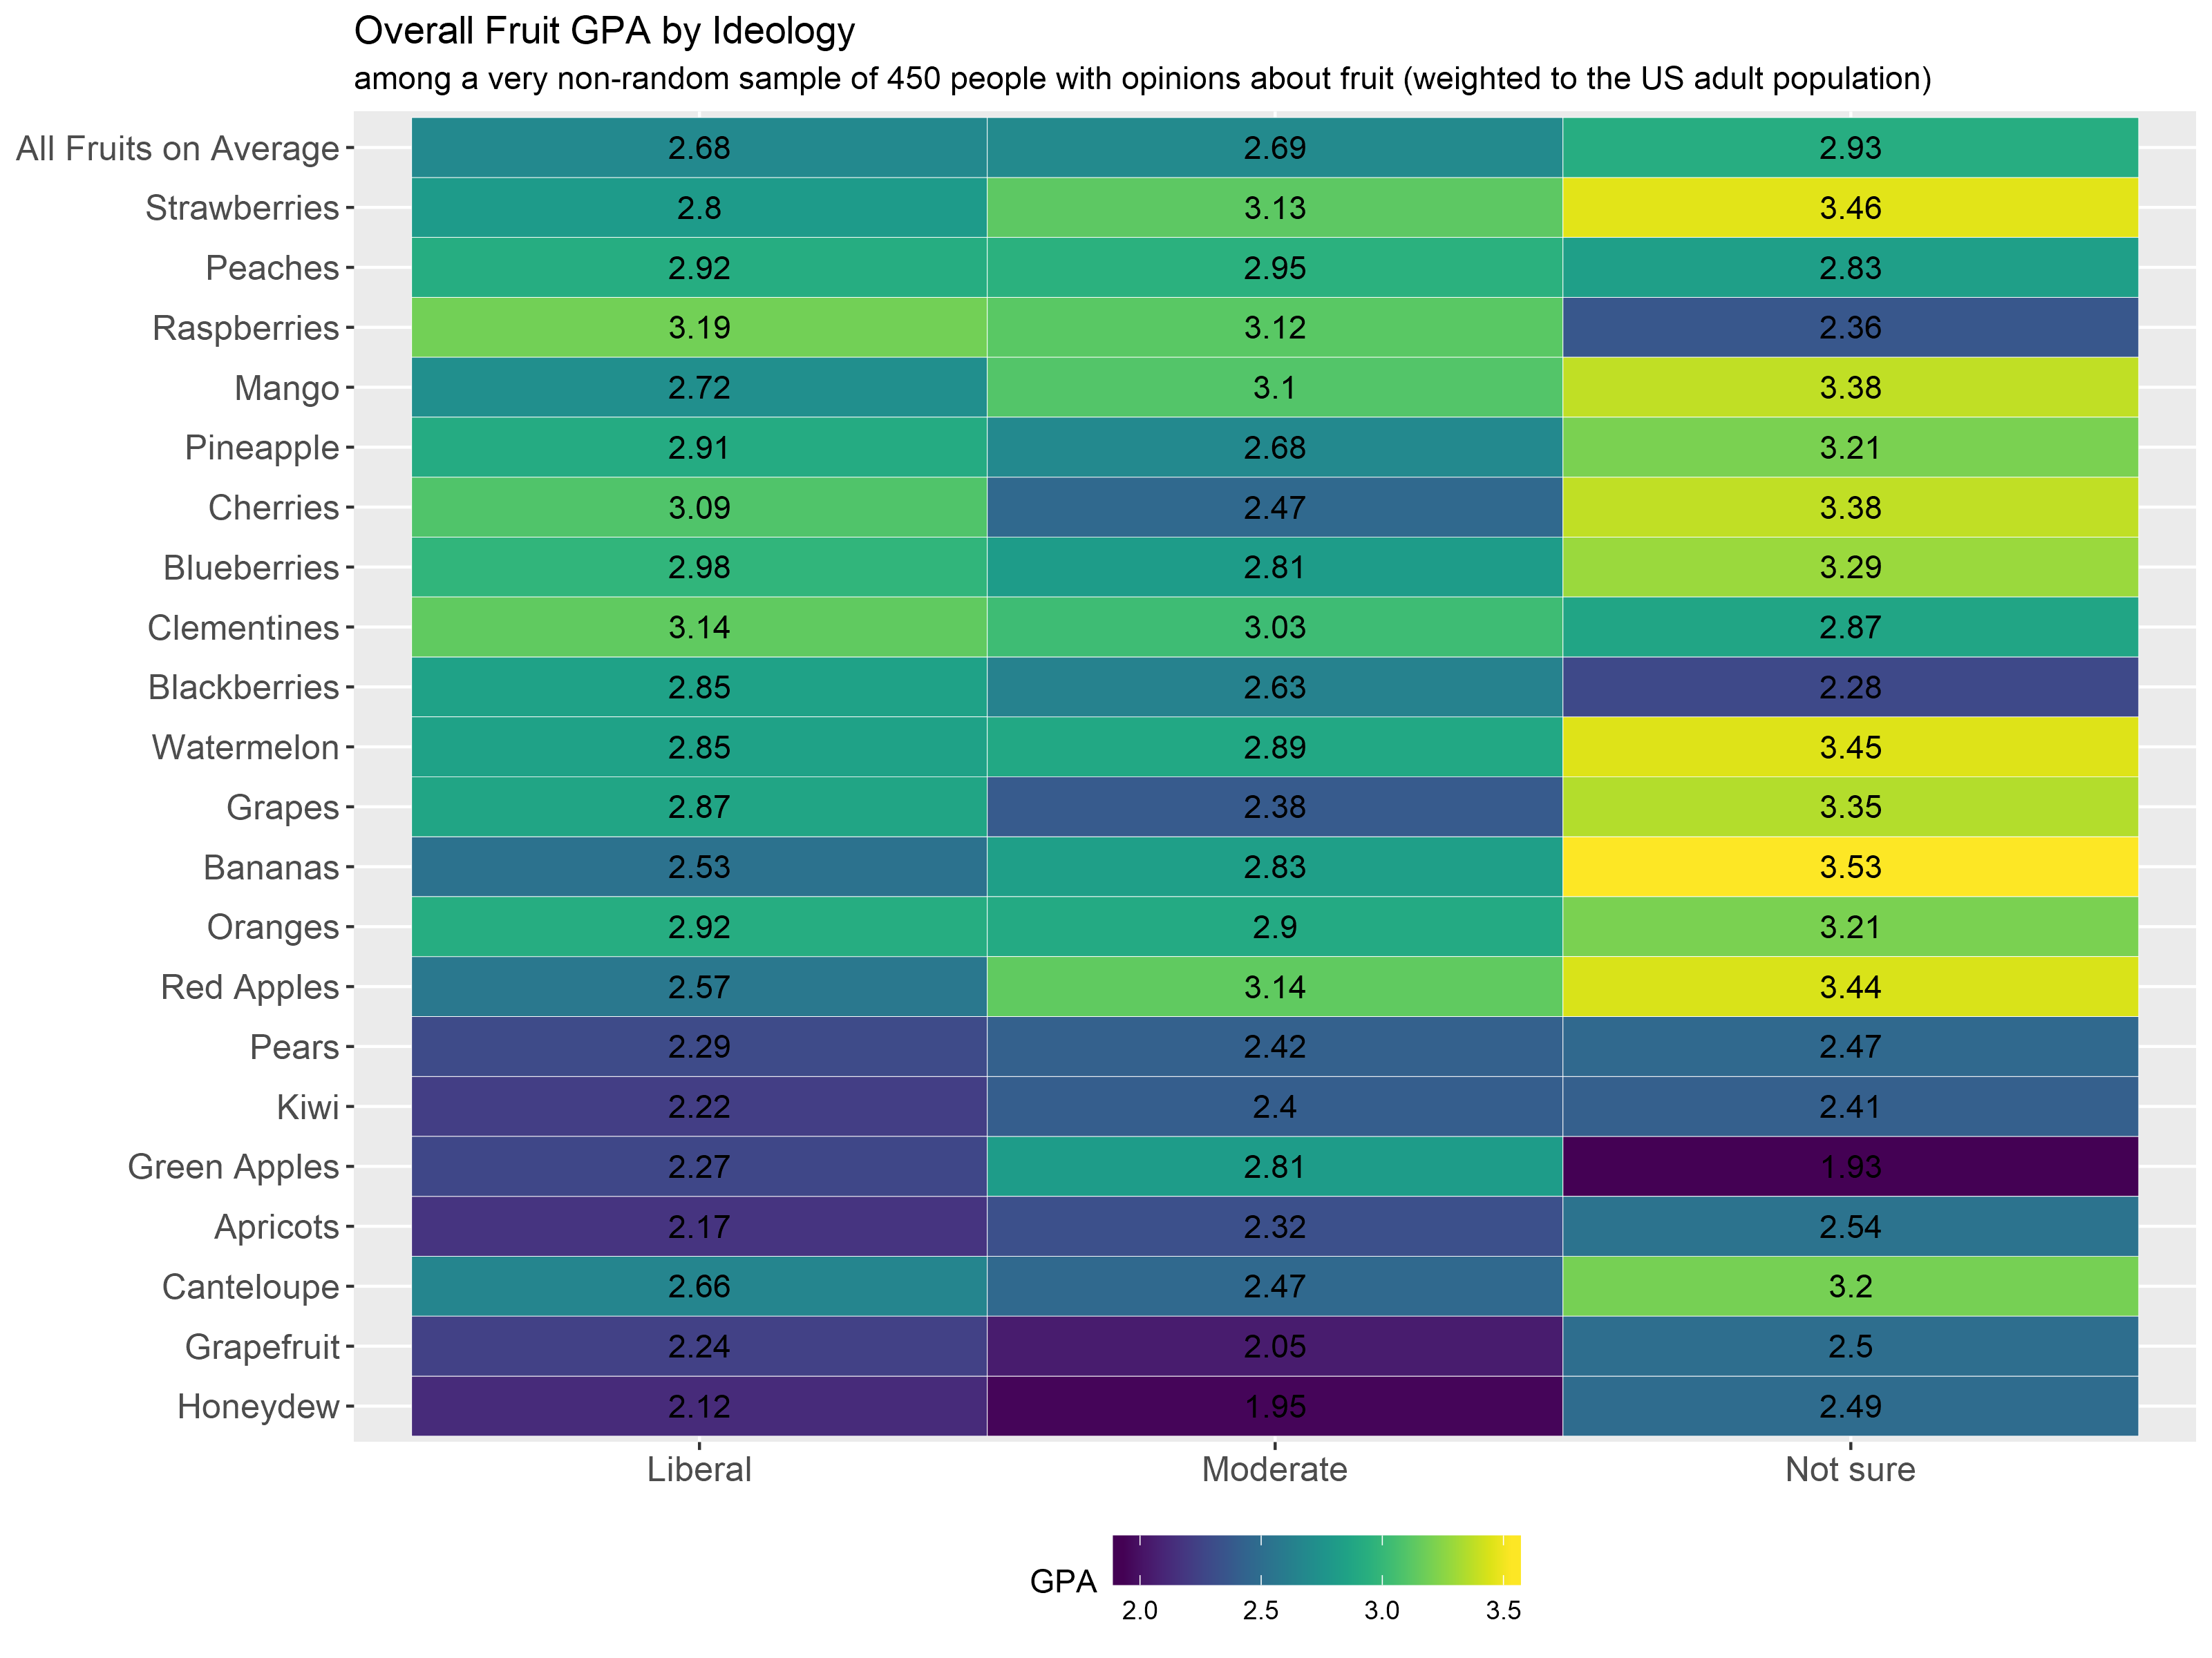
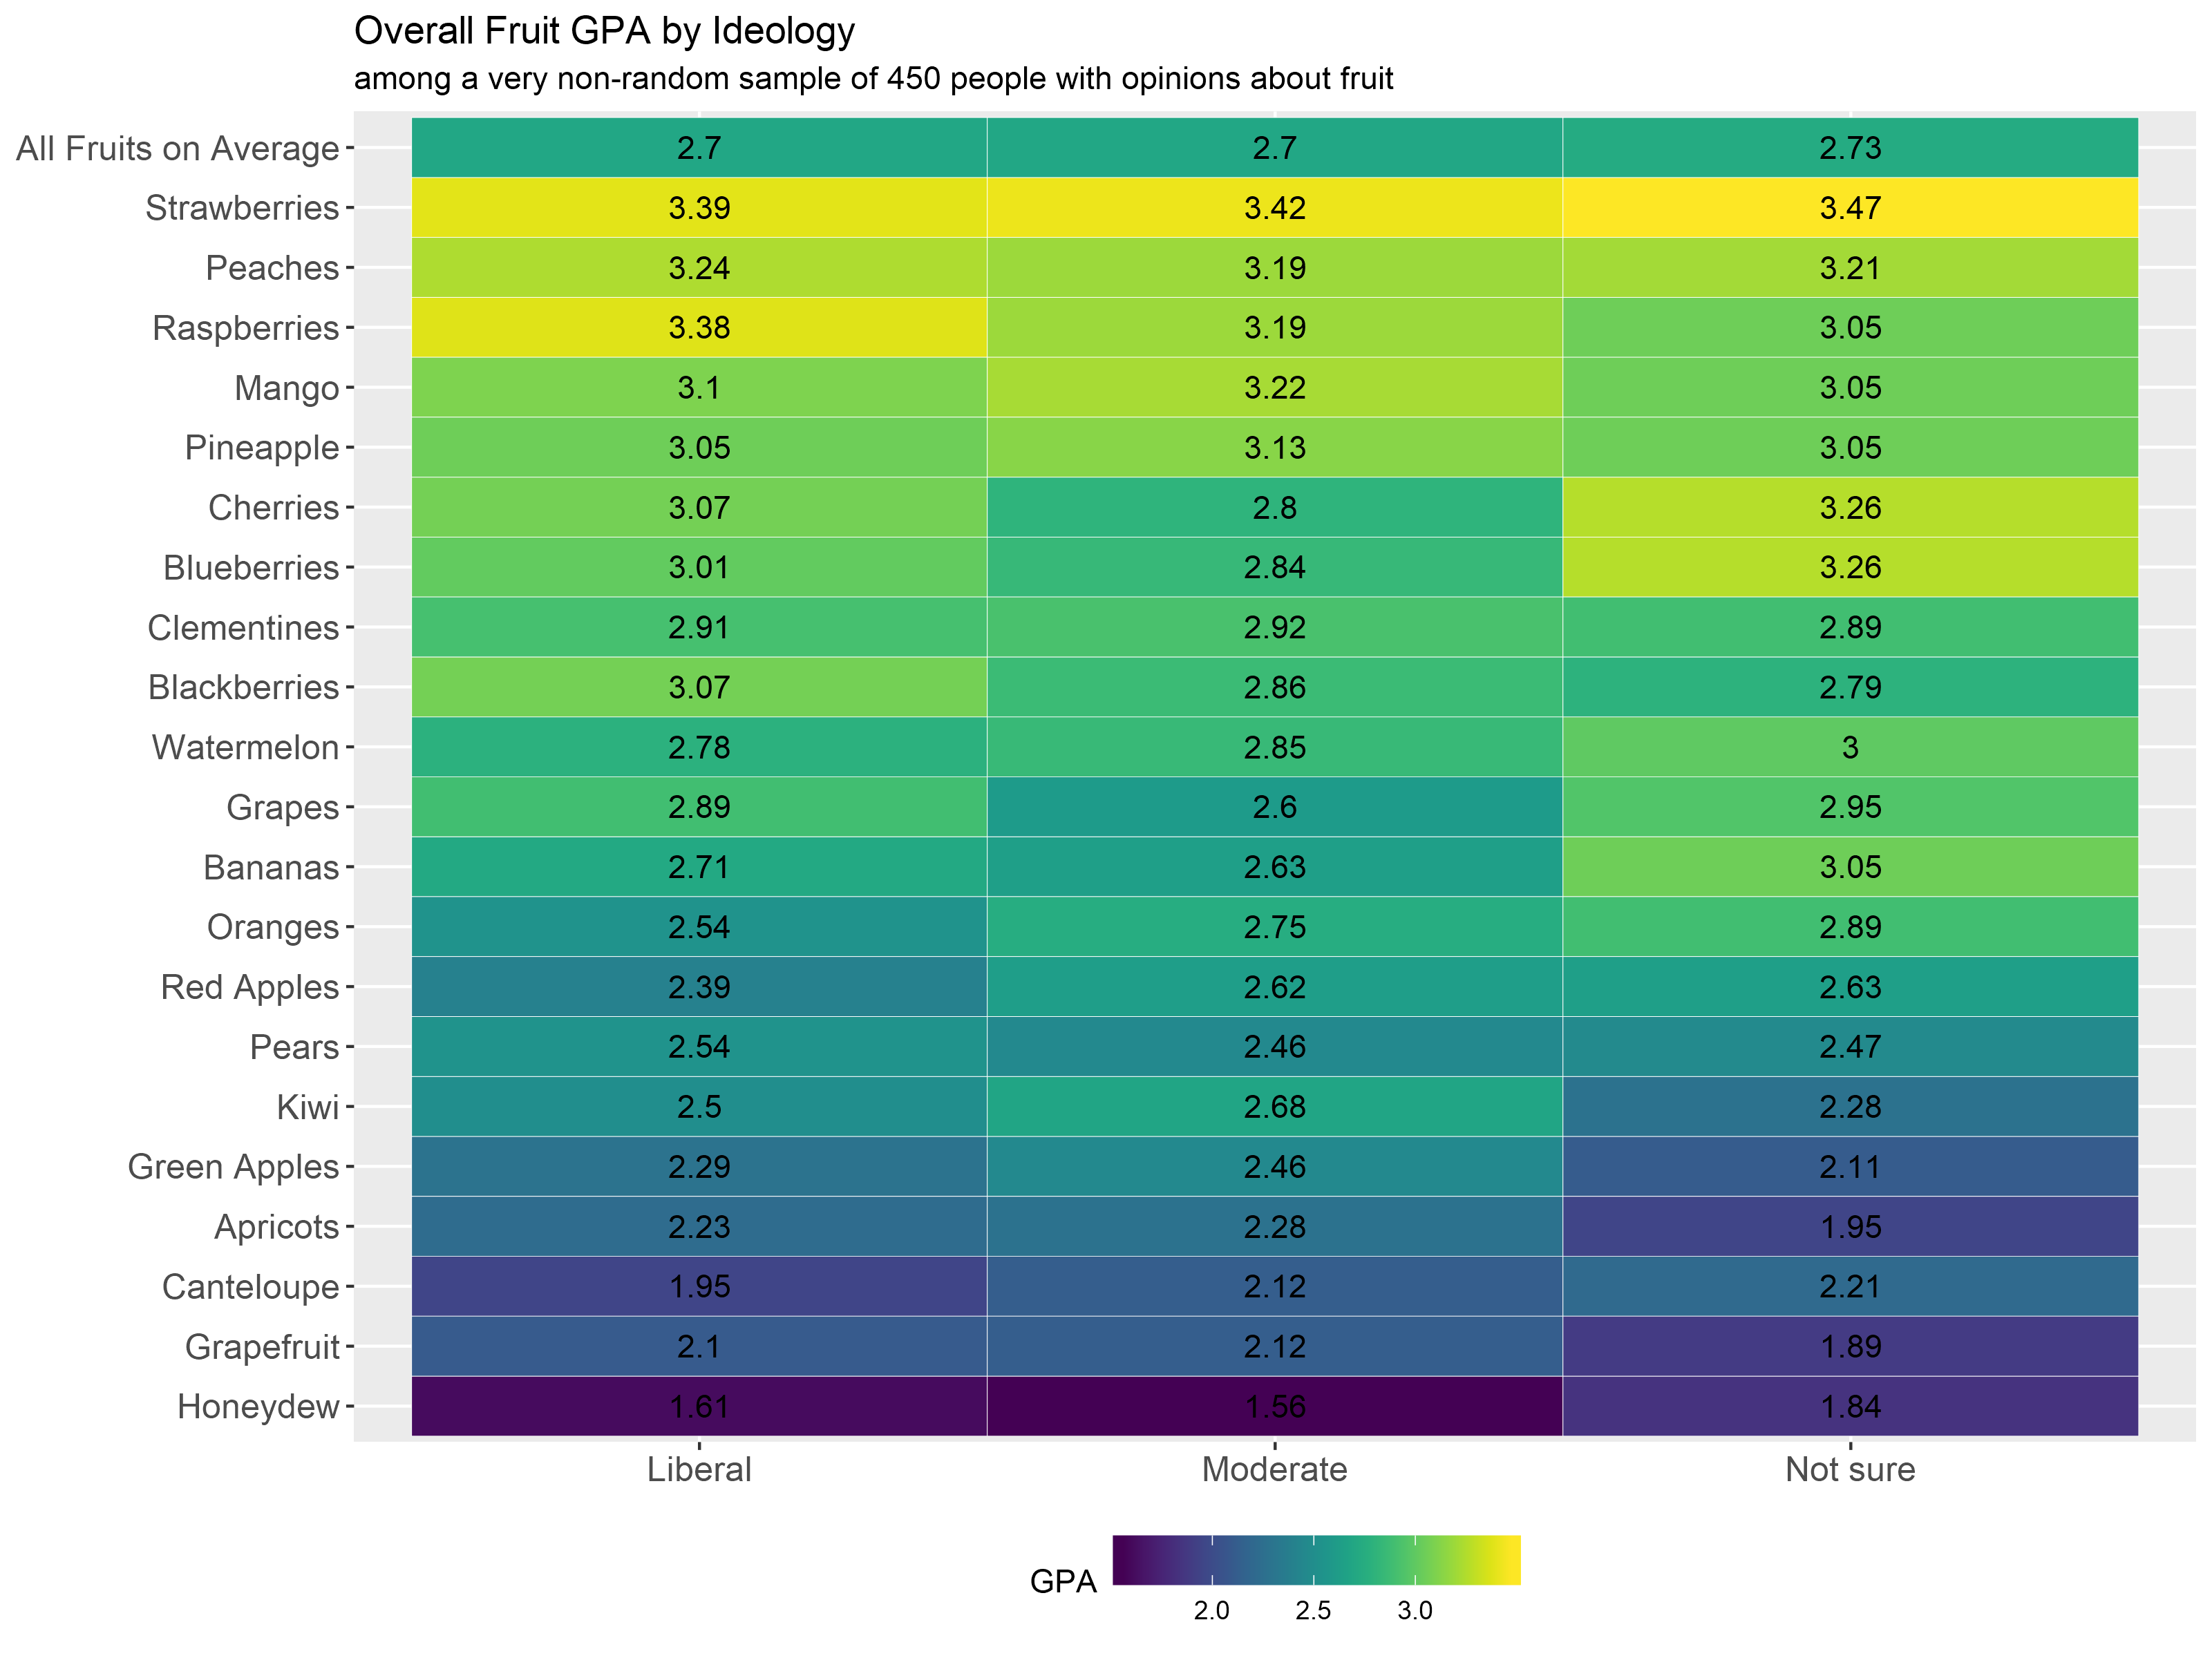
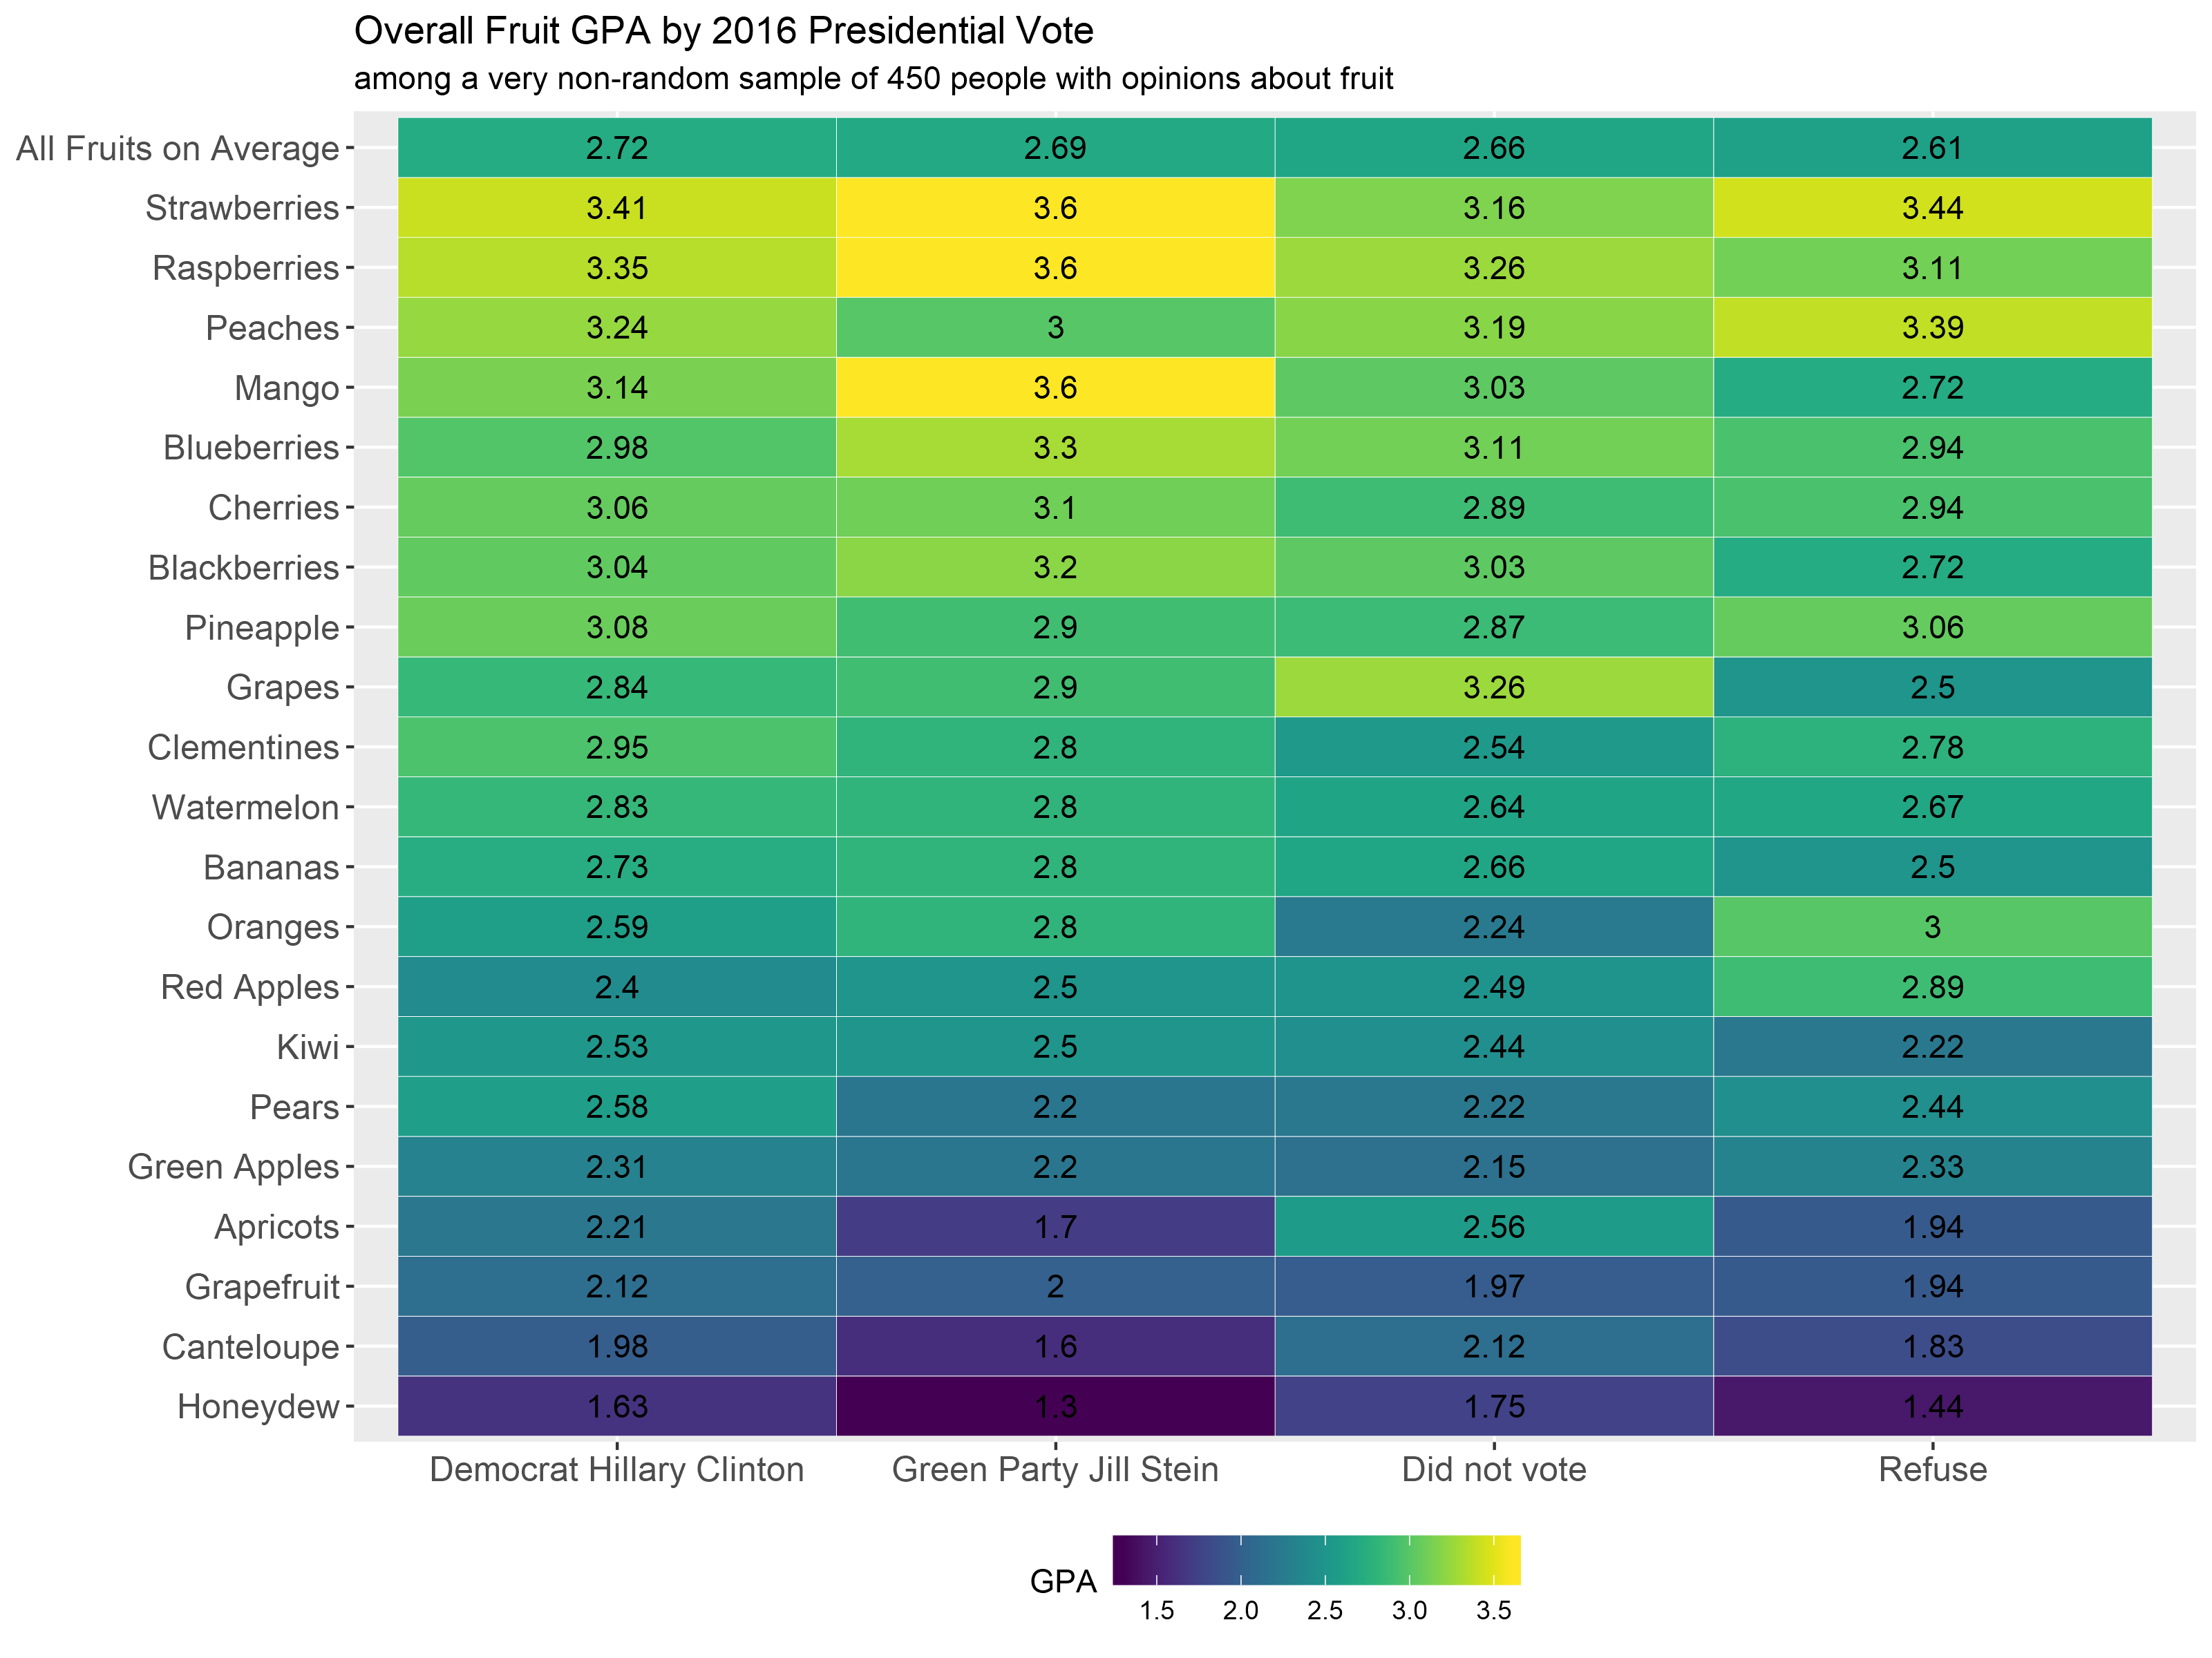
The survey also asks a number of political questions, such as Party ID, ideology, and 2016 presidential vote. However, because of my massive and apparent political bubble, there aren’t enough conservative/Trump voters to really look at them in detail. So if you get into a political argument with your family over the holidays, you can deflect by having them take this survey.
Although it’s not very difficult to get pretty much any fruit throughout the country thanks to our developed agricultural and transportation infrastructure, I was curious to see if geography played a role in attitudes towards specific fruits. In most states, raspberries and strawberries are ranked the highest, with the exception of a few states. Washingtonians in particular rated blueberries the highest, which might have something to do with the state’s high production of blueberries.
Why Pennsylvanians hate kiwis so much is beyond me.
States/regions with less than 10 respondents were excluded from the table below.
| Highest/Lowest Rated Fruits by State | |||
| Fruit | Average GPA | ||
|---|---|---|---|
| California | |||
| Highest Rated | Raspberries | 3.58 | |
| Lowest Rated | Honeydew | 1.6 | |
| District of Columbia | |||
| Highest Rated | Strawberries | 3.54 | |
| Lowest Rated | Honeydew | 1.3 | |
| Illinois | |||
| Highest Rated | Pineapple | 3.77 | |
| Lowest Rated | Honeydew | 1.62 | |
| Maryland | |||
| Highest Rated | Strawberries | 3.5 | |
| Lowest Rated | Honeydew | 1.78 | |
| Massachusetts | |||
| Highest Rated | Strawberries | 3.6 | |
| Lowest Rated | Honeydew | 1.6 | |
| Michigan | |||
| Highest Rated | Raspberries | 3.4 | |
| Lowest Rated | Honeydew | 1.77 | |
| New York | |||
| Highest Rated | Strawberries | 3.31 | |
| Lowest Rated | Honeydew | 1.96 | |
| Outside of US | |||
| Highest Rated | Raspberries | 3.39 | |
| Lowest Rated | Honeydew | 1.44 | |
| Pennsylvania | |||
| Highest Rated | Raspberries | 3.69 | |
| Lowest Rated | Kiwi | 1.85 | |
| Virginia | |||
| Highest Rated | Strawberries | 3.31 | |
| Lowest Rated | Honeydew | 1.38 | |
| Washington | |||
| Highest Rated | Blueberries | 3.45 | |
| Lowest Rated | Green Apples | 1.27 | |
| Wisconsin | |||
| Highest Rated | Raspberries/Cherries | 3.35 | |
| Lowest Rated | Honeydew | 1.73 | |
Next, by aggregating states within regions, we can see the most popular fruits by census region. Not surprisingly, strawberries and raspberries reign supreme across the country, with an interesting East/West divide.
While many articles are written about the ever growing rift between Urban and Rural America, one thing appears to unite us all: our hatred of honeydew. Respondents who grew up in urban zip codes rated the fruit exactly the same as those who grew up rural zip codes.
On average, urban respondents rated most fruits higher than their rural counterparts. However, fruits like Apricots, Red Apples, and Pears are more popular among rural respondents.
If a fruit falls below the diagonal line in the chart below, that means that the fruit is ranked higher among respondents that grew up in urban areas compared to those who grew up in rural areas. And the opposite is true if a fruit is above the diagonal line. The 2010 Urban Area Relationship file provided by the US Census was used to define urban/rural zip codes. Like most parts of this analysis, there is a demographic skew: less than 10% of respondents that put in a valid zip code grew up in a rural area.
Fruit or Not Fruit!
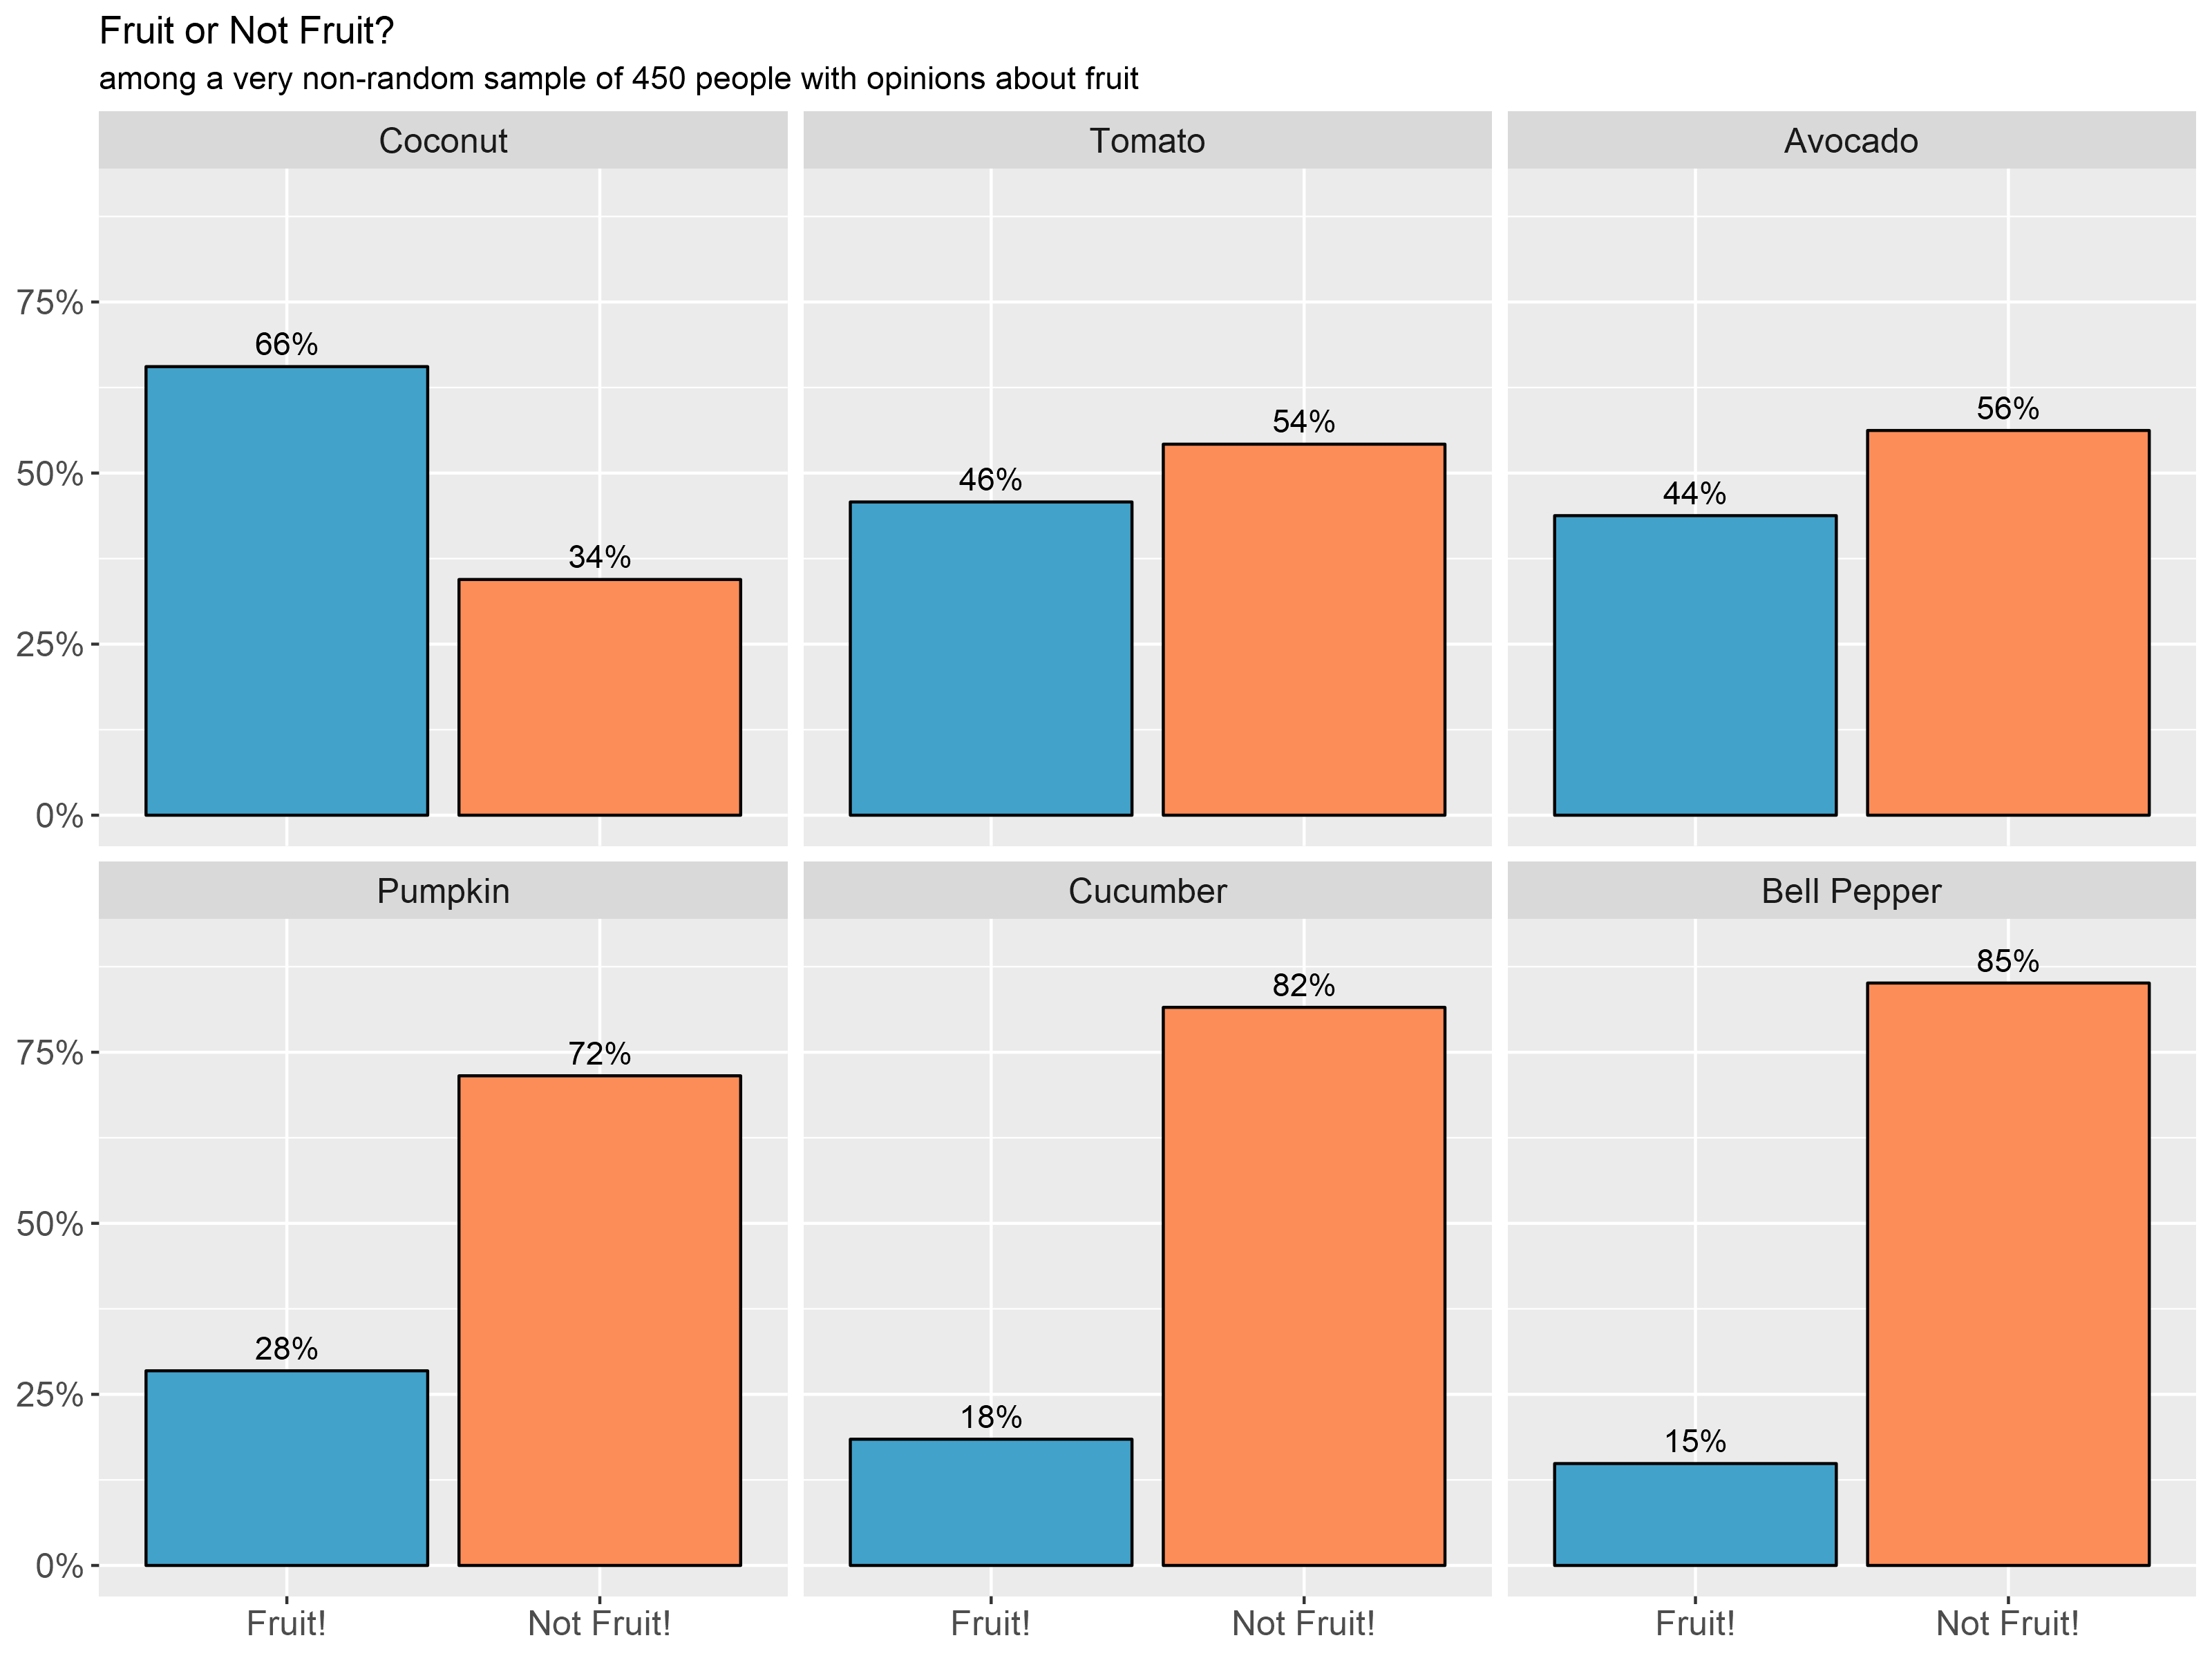
After ranking fruit, respondents were then asked to weigh in on the question: are these items fruit or not fruit?
Despite the fact that all of the items presented are technically classified as fruits, the consensus appears to be that all but one of the items are not fruit. Respondents were more divided on tomato and avocado, split nearly down the middle, while overwhelmingly rejecting pumpkin, cucumber, and bell pepper. Coconuts are the lone food item that a majority of respondents agree is actually a fruit.
Men and women are unified in their opinions towards the resounding not-fruits pumpkin, Cucumber, and Bell Pepper. However things start to fall apart with avocado and tomato. Men and non-binary respondents tend to view avocado and tomato as a fruit more than women.

All (11) of the Hispanic/Latino respondents are in agreement, cucumber is very much not a fruit and a majority stated avocados are not fruit. A majority of the (29) Asian/Pacific Islander respondents stated that avocados and tomatoes are fruits. Black respondents were the only racial group to be evenly divided on the status of the coconut.

Again, there is an apparent and interesting ideological divide on attitudes towards fruit by age. On average, respondents over 50 years old stated that each item was more of fruit than respondents under 50. The schisms are most apparent with tomatoes, avocados, and pumpkins.

Thanks & Conclusions
In conclusion, if you wanted to make the “best” smoothie (as determined by everyone who took this survey), grab a bunch of strawberries, raspberries, peaches, mangoes, and pineapple. If you’re a monster and want to make the “worst” smoothie, well just grab honeydew, cantaloupe, green apples, and apricots.
Thank you again to everyone who shared this survey. The fact that I was able to collect the opinions of 450 people in only three days while spending no money blows my mind. This work wouldn’t have been possible without all of you.
I hope to use this data in a few more projects in the future and will update this website with more fruit related things. All of the code used for this analysis can be found in my GitHub repo.
I’ll end this with a link to the survey in case you missed it: (https://goo.gl/forms/92TnNIjexX4Maam63)
Survey Demographics
| Demographic Summary Table | |||
| Response | N | Percent | |
|---|---|---|---|
| Gender | |||
| Male | 144 | 32% | |
| Female | 283 | 64% | |
| Other | 17 | 4% | |
| Race/Ethnicity | |||
| White/Caucasian | 360 | 81% | |
| Black or African American | 12 | 3% | |
| Hispanic or Latino | 11 | 2% | |
| Asian/Pacific Islander | 29 | 7% | |
| American Indian or Alaskan Native | 3 | 1% | |
| Multiple ethnicity/Other | 29 | 7% | |
| Age | |||
| 18-24 | 58 | 13% | |
| 25-29 | 203 | 45% | |
| 30-34 | 99 | 22% | |
| 35-39 | 48 | 11% | |
| 40-44 | 18 | 4% | |
| 45-49 | 8 | 2% | |
| 50+ | 16 | 4% | |
| Household Income | |||
| Under $50,000 | 160 | 36% | |
| $50,000 to $100,000 | 147 | 33% | |
| Over $100,000 | 94 | 21% | |
| Not sure/Refuse | 43 | 10% | |
| 2016 Presidential Vote | |||
| Democrat Hillary Clinton | 374 | 84% | |
| Republican Donald Trump | 3 | 1% | |
| Green Party Jill Stein | 10 | 2% | |
| Libertarian Gary Johnson | 2 | 0% | |
| Did not vote | 37 | 8% | |
| Refuse | 18 | 4% | |
| Party ID Initial | |||
| Democrat | 346 | 78% | |
| Independent | 61 | 14% | |
| Republican | 7 | 2% | |
| Not sure | 30 | 7% | |
| Ideology | |||
| Liberal | 369 | 83% | |
| Moderate | 52 | 12% | |
| Conservative | 4 | 1% | |
| Not sure | 19 | 4% | |
Weighted Results