
Bike Accidents In The District

Introduction
Seeing as I previously wrote about one of my favorite past times - Whisky - I figured I would explore one of my least favorite things next: bike accidents.
Thanks to the DC Government’s OpenData Portal, we can explore the frequency bike accidents and attempt to answer a few questions about bike accidents. The DC Department of Transportation maintains a log of all reported (an important caveat to the data) traffic accidents since August 2015, as well as some helpful metadata, such as the age of all parties involved. I downloaded the data and filtered the data set to any accident over the past three years that involved at least one bicyclist. I also pulled in some other data provided by DC DataPortal, including road and bike lane data, as well as weather data from the National Weather Service.
An important note to preface this project: the accident data gives us a sense of where/when accidents happen in the district, but it’s difficult to disentangle accidents and overall ridership patterns. I may say something like “X street is the most dangerous because it has Y number of accidents.” This may make it seem like there is something structurally wrong with or dangerous about the street, when in reality it may simply be that road is one of the more popular routes and actually has a proportionally lower number of accidents compared to other streets. However, we can use this accident data as a way to not only find where/when accidents happen, but also establish patterns of ridership in DC. As far as I can tell there is a dearth of data out there that tracks ridership patterns and demographics of all bicyclists. Consider this an unfortunate survey of bicyclists in DC with a very specific selection bias.
Getting Started
Since August 2015 there have been just over ~1,200* reported accidents involving bicycles in Washington DC.
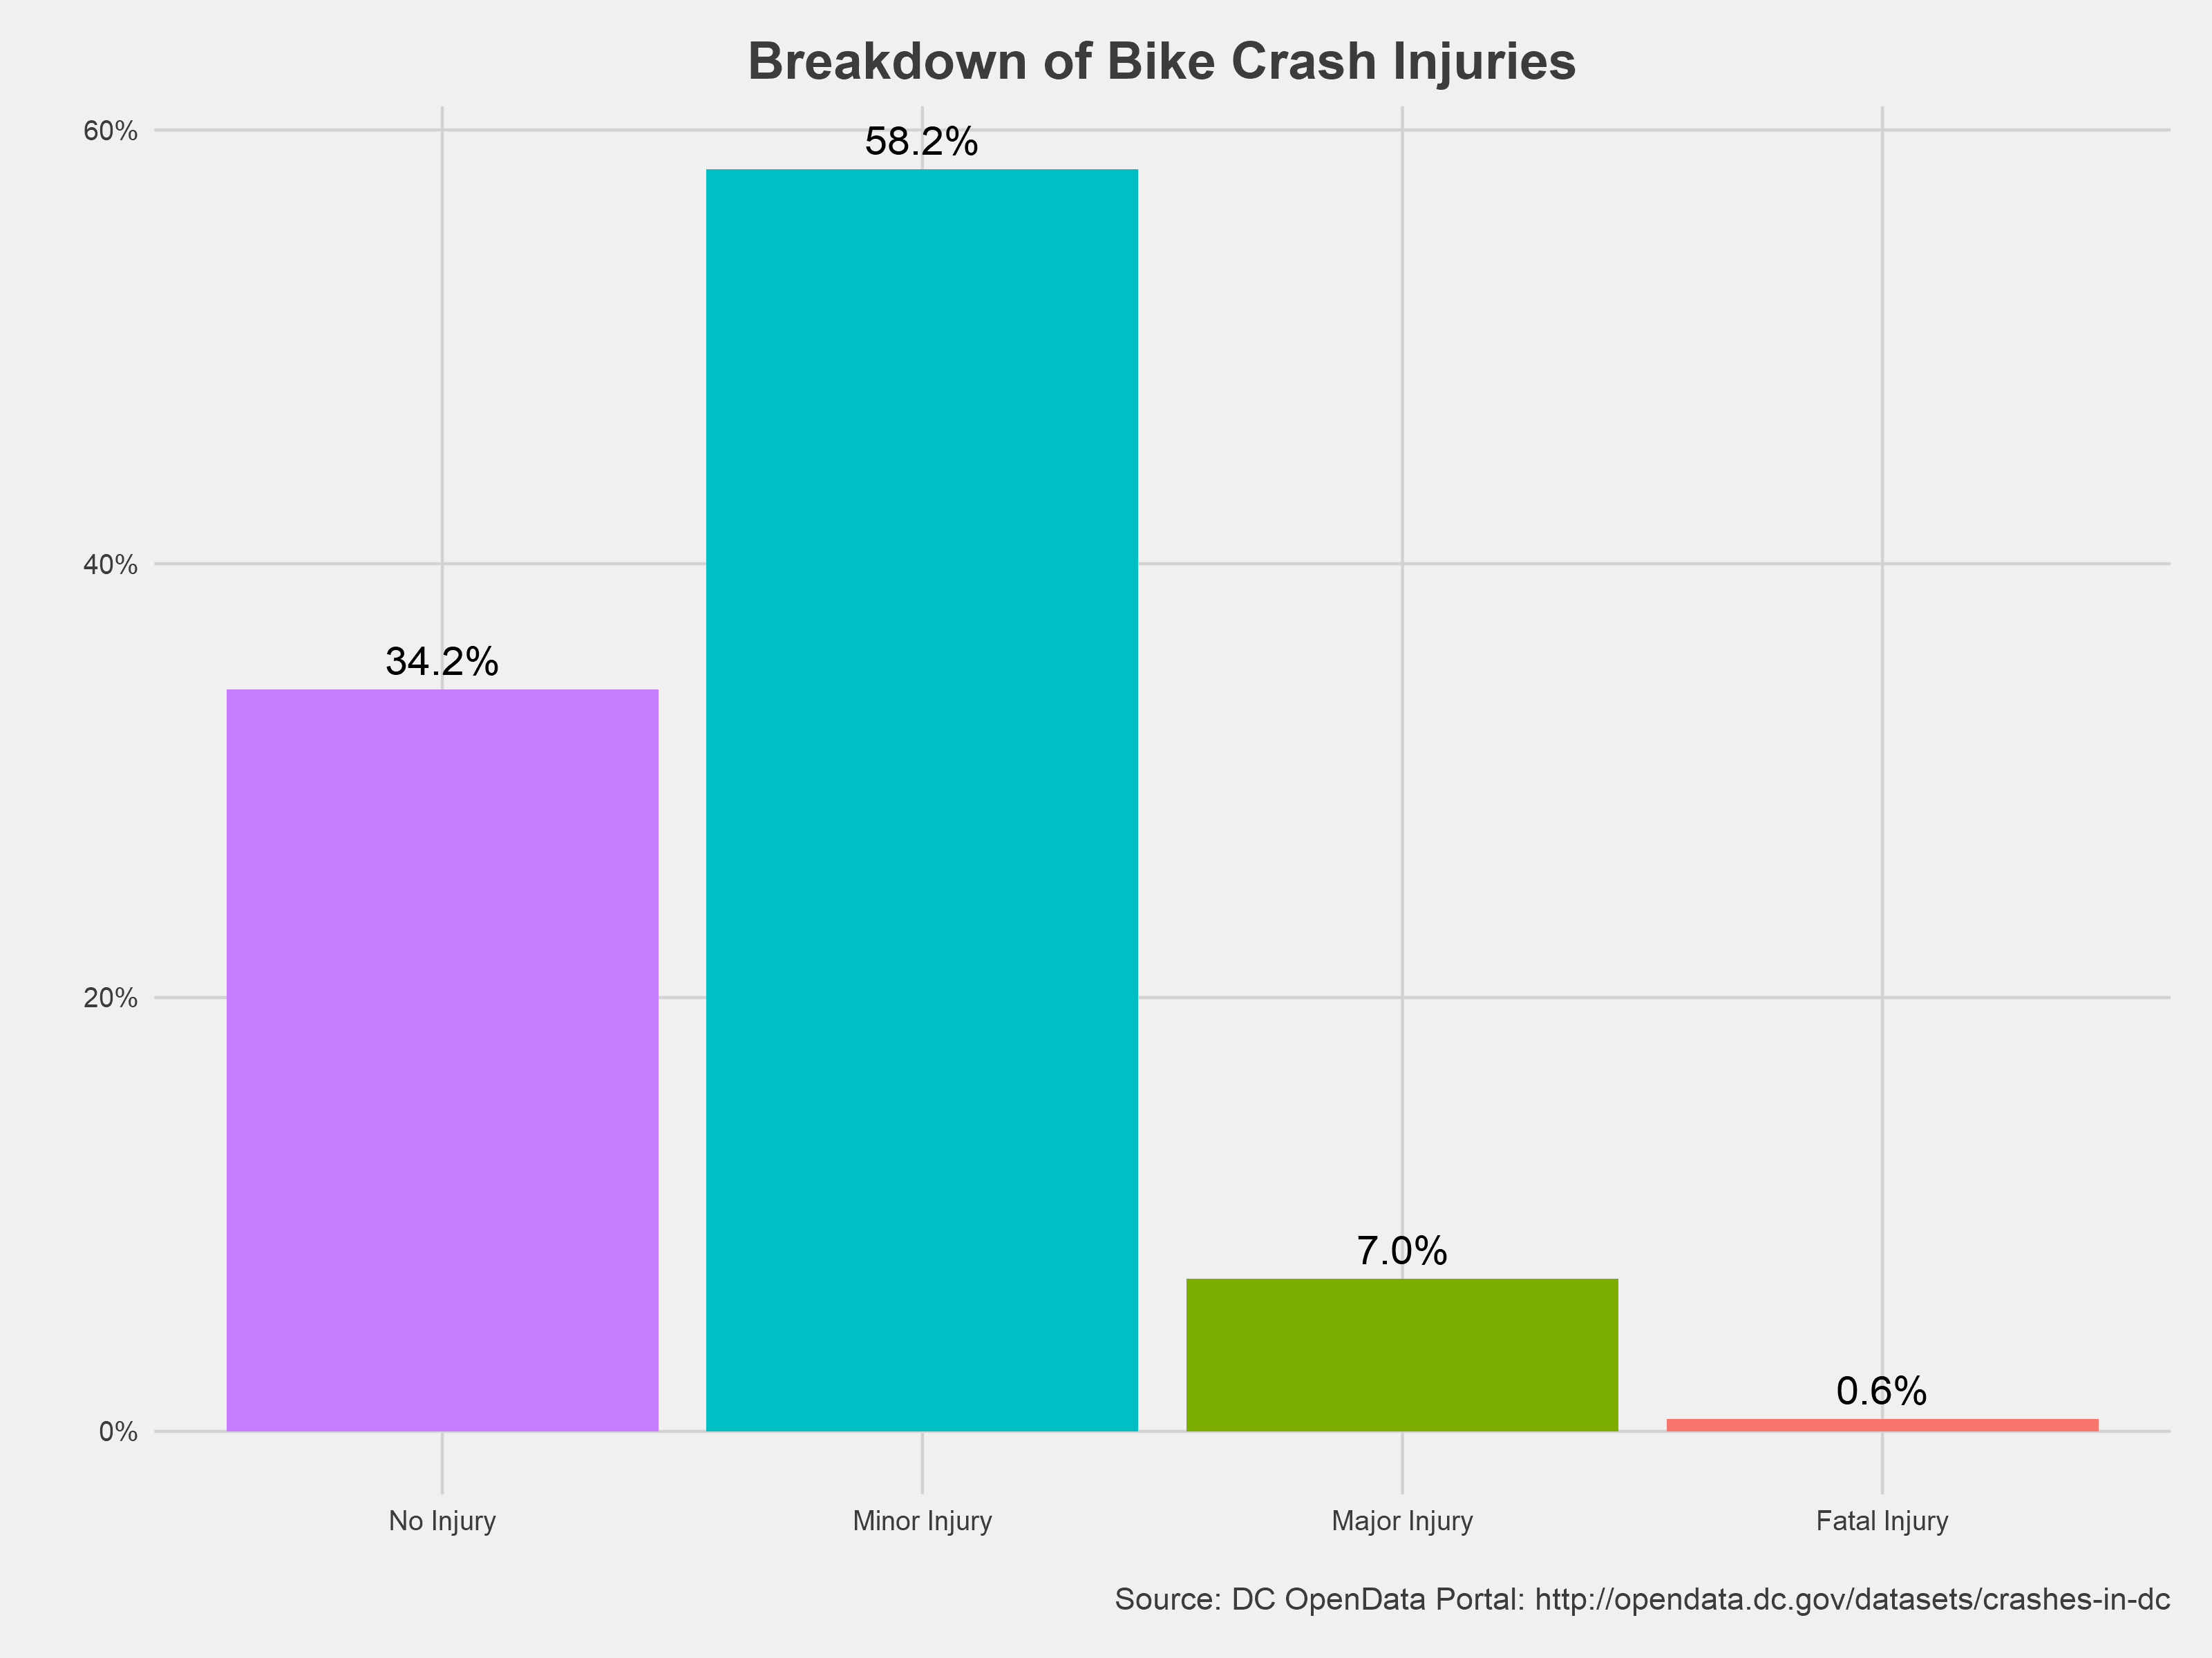
Of the 1,200 accidents, nearly 60% of the cyclists involved sustained what the Department of Transportation classified as “minor injuries,” while a third of cyclists were able to walk away without any injuries.
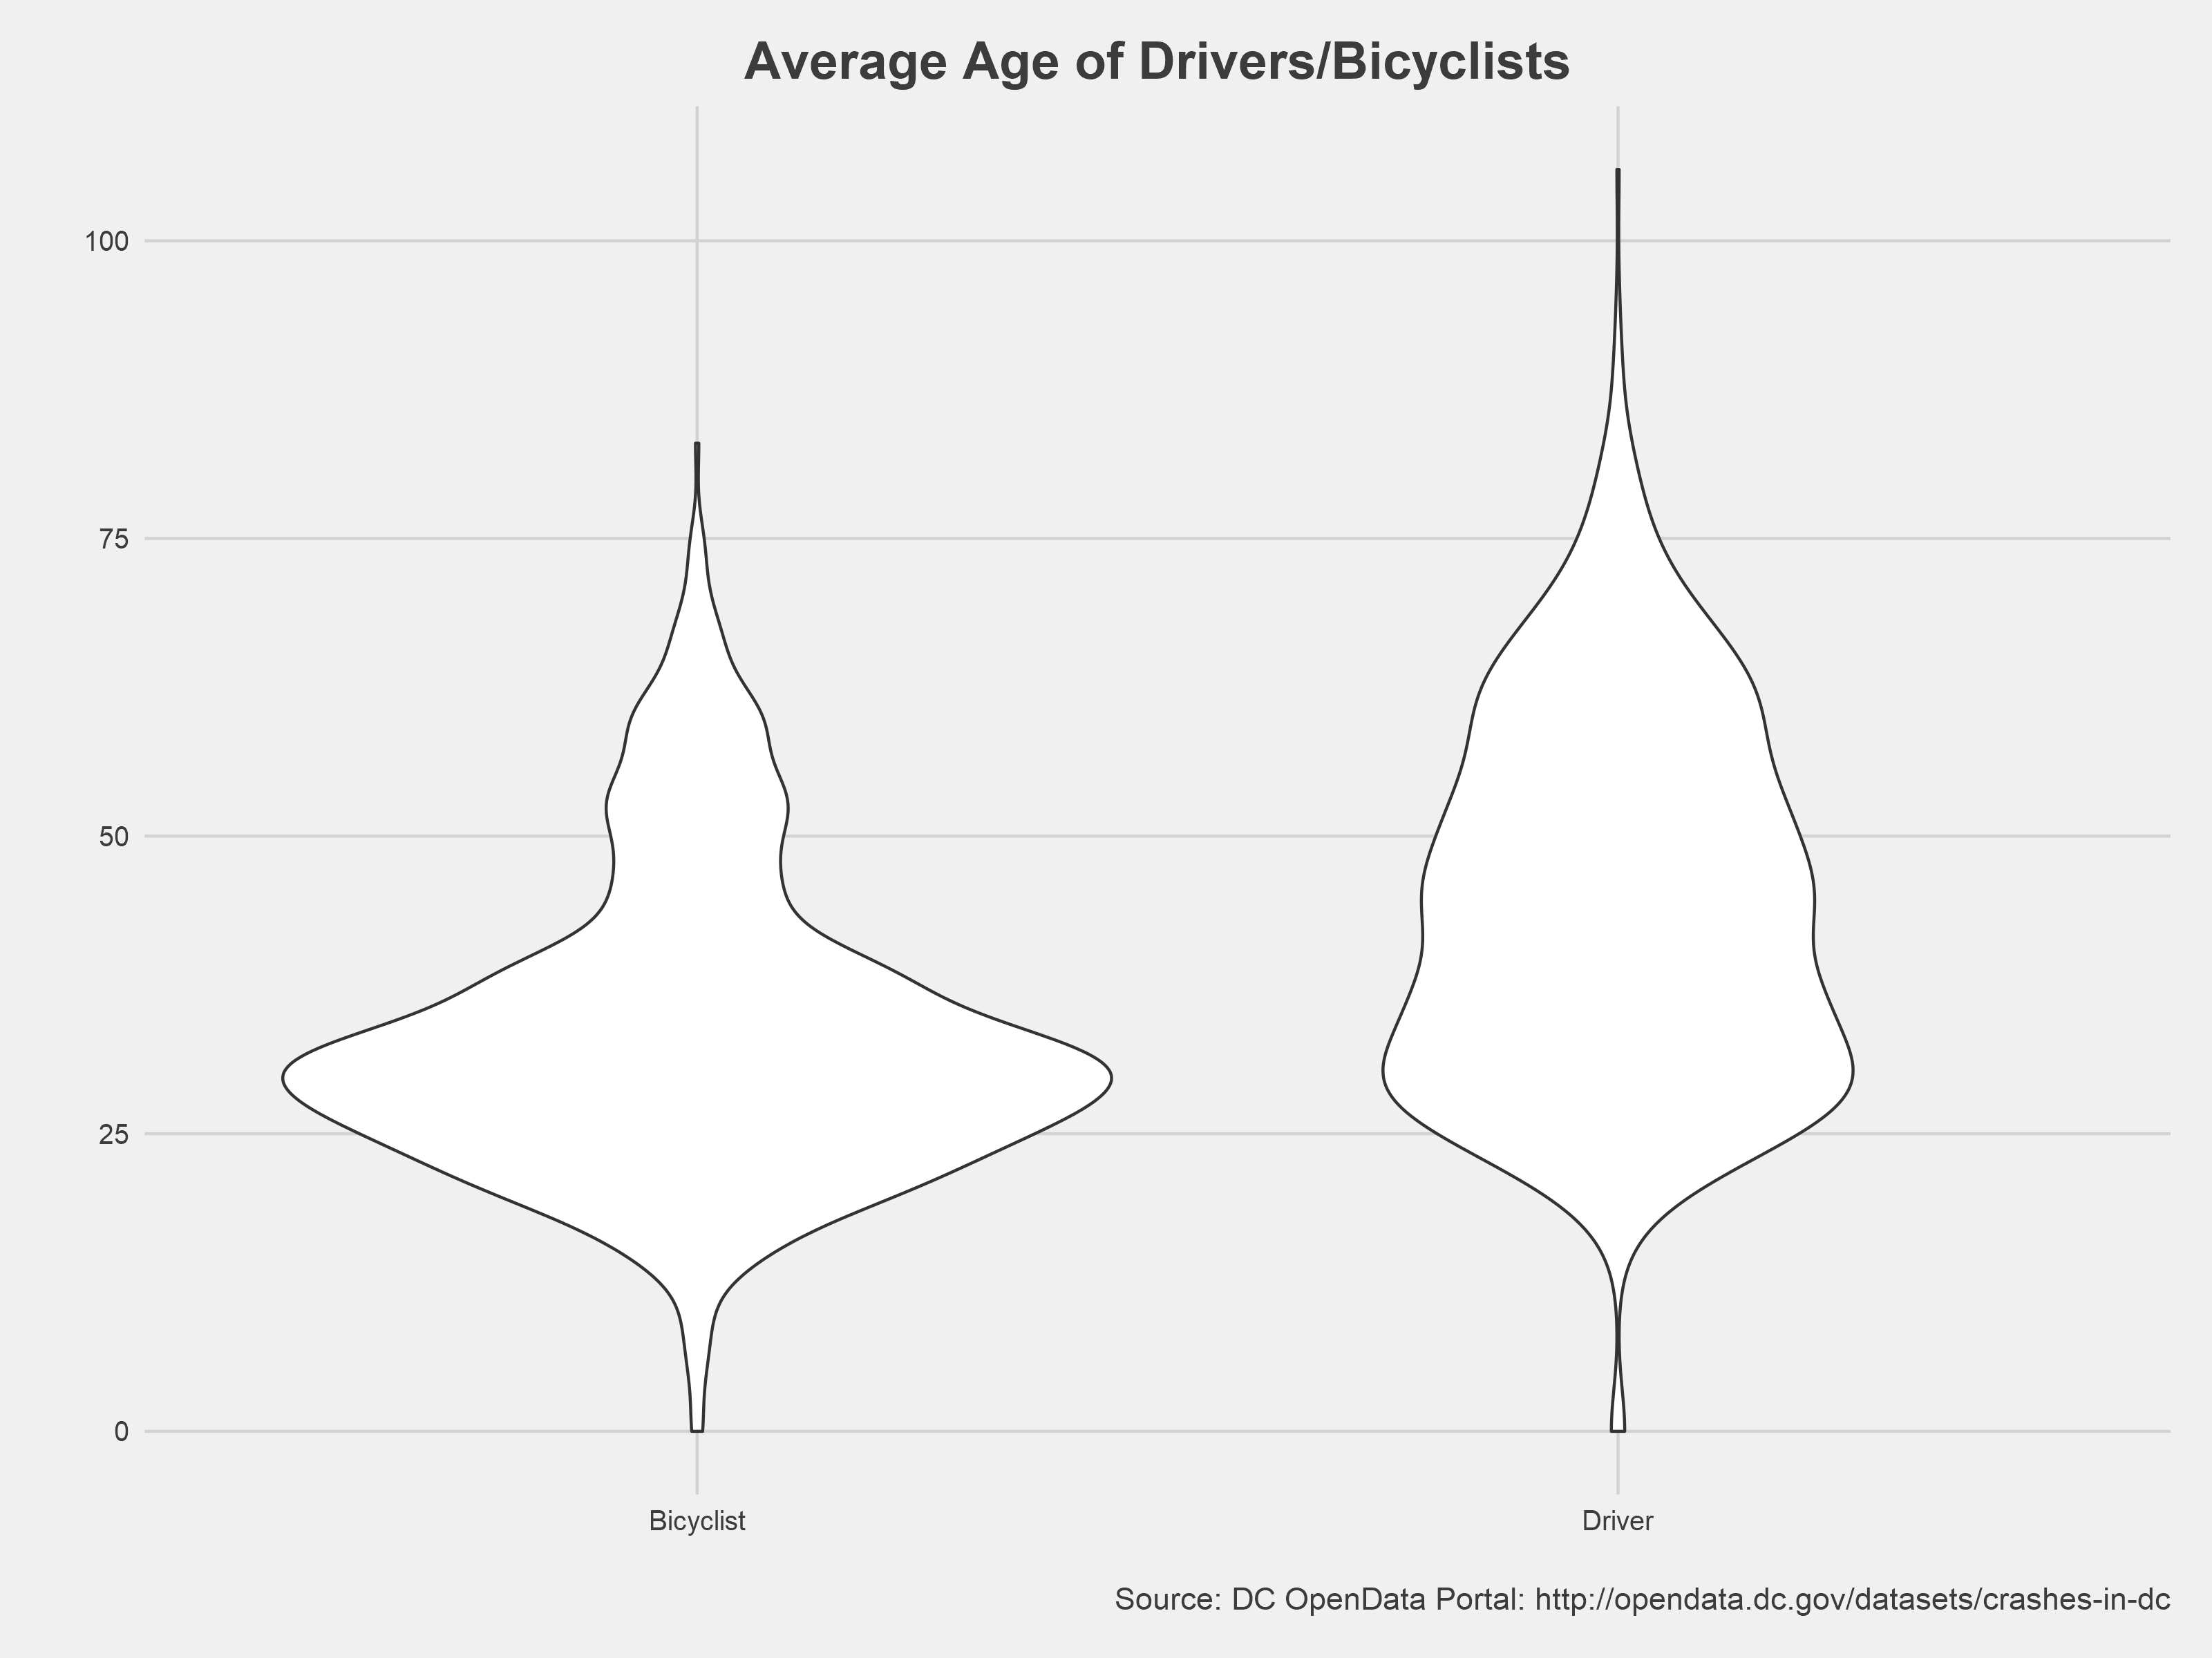
Not surprisingly, cyclists involved in the accidents skew younger than drivers, with an average age of 34 compared to driver’s 44. This isn’t to say that younger cyclists are more likely to be involved in accidents, more that this follows the demographics of the overall population of cyclists.
Are Maryland drivers really the worst?
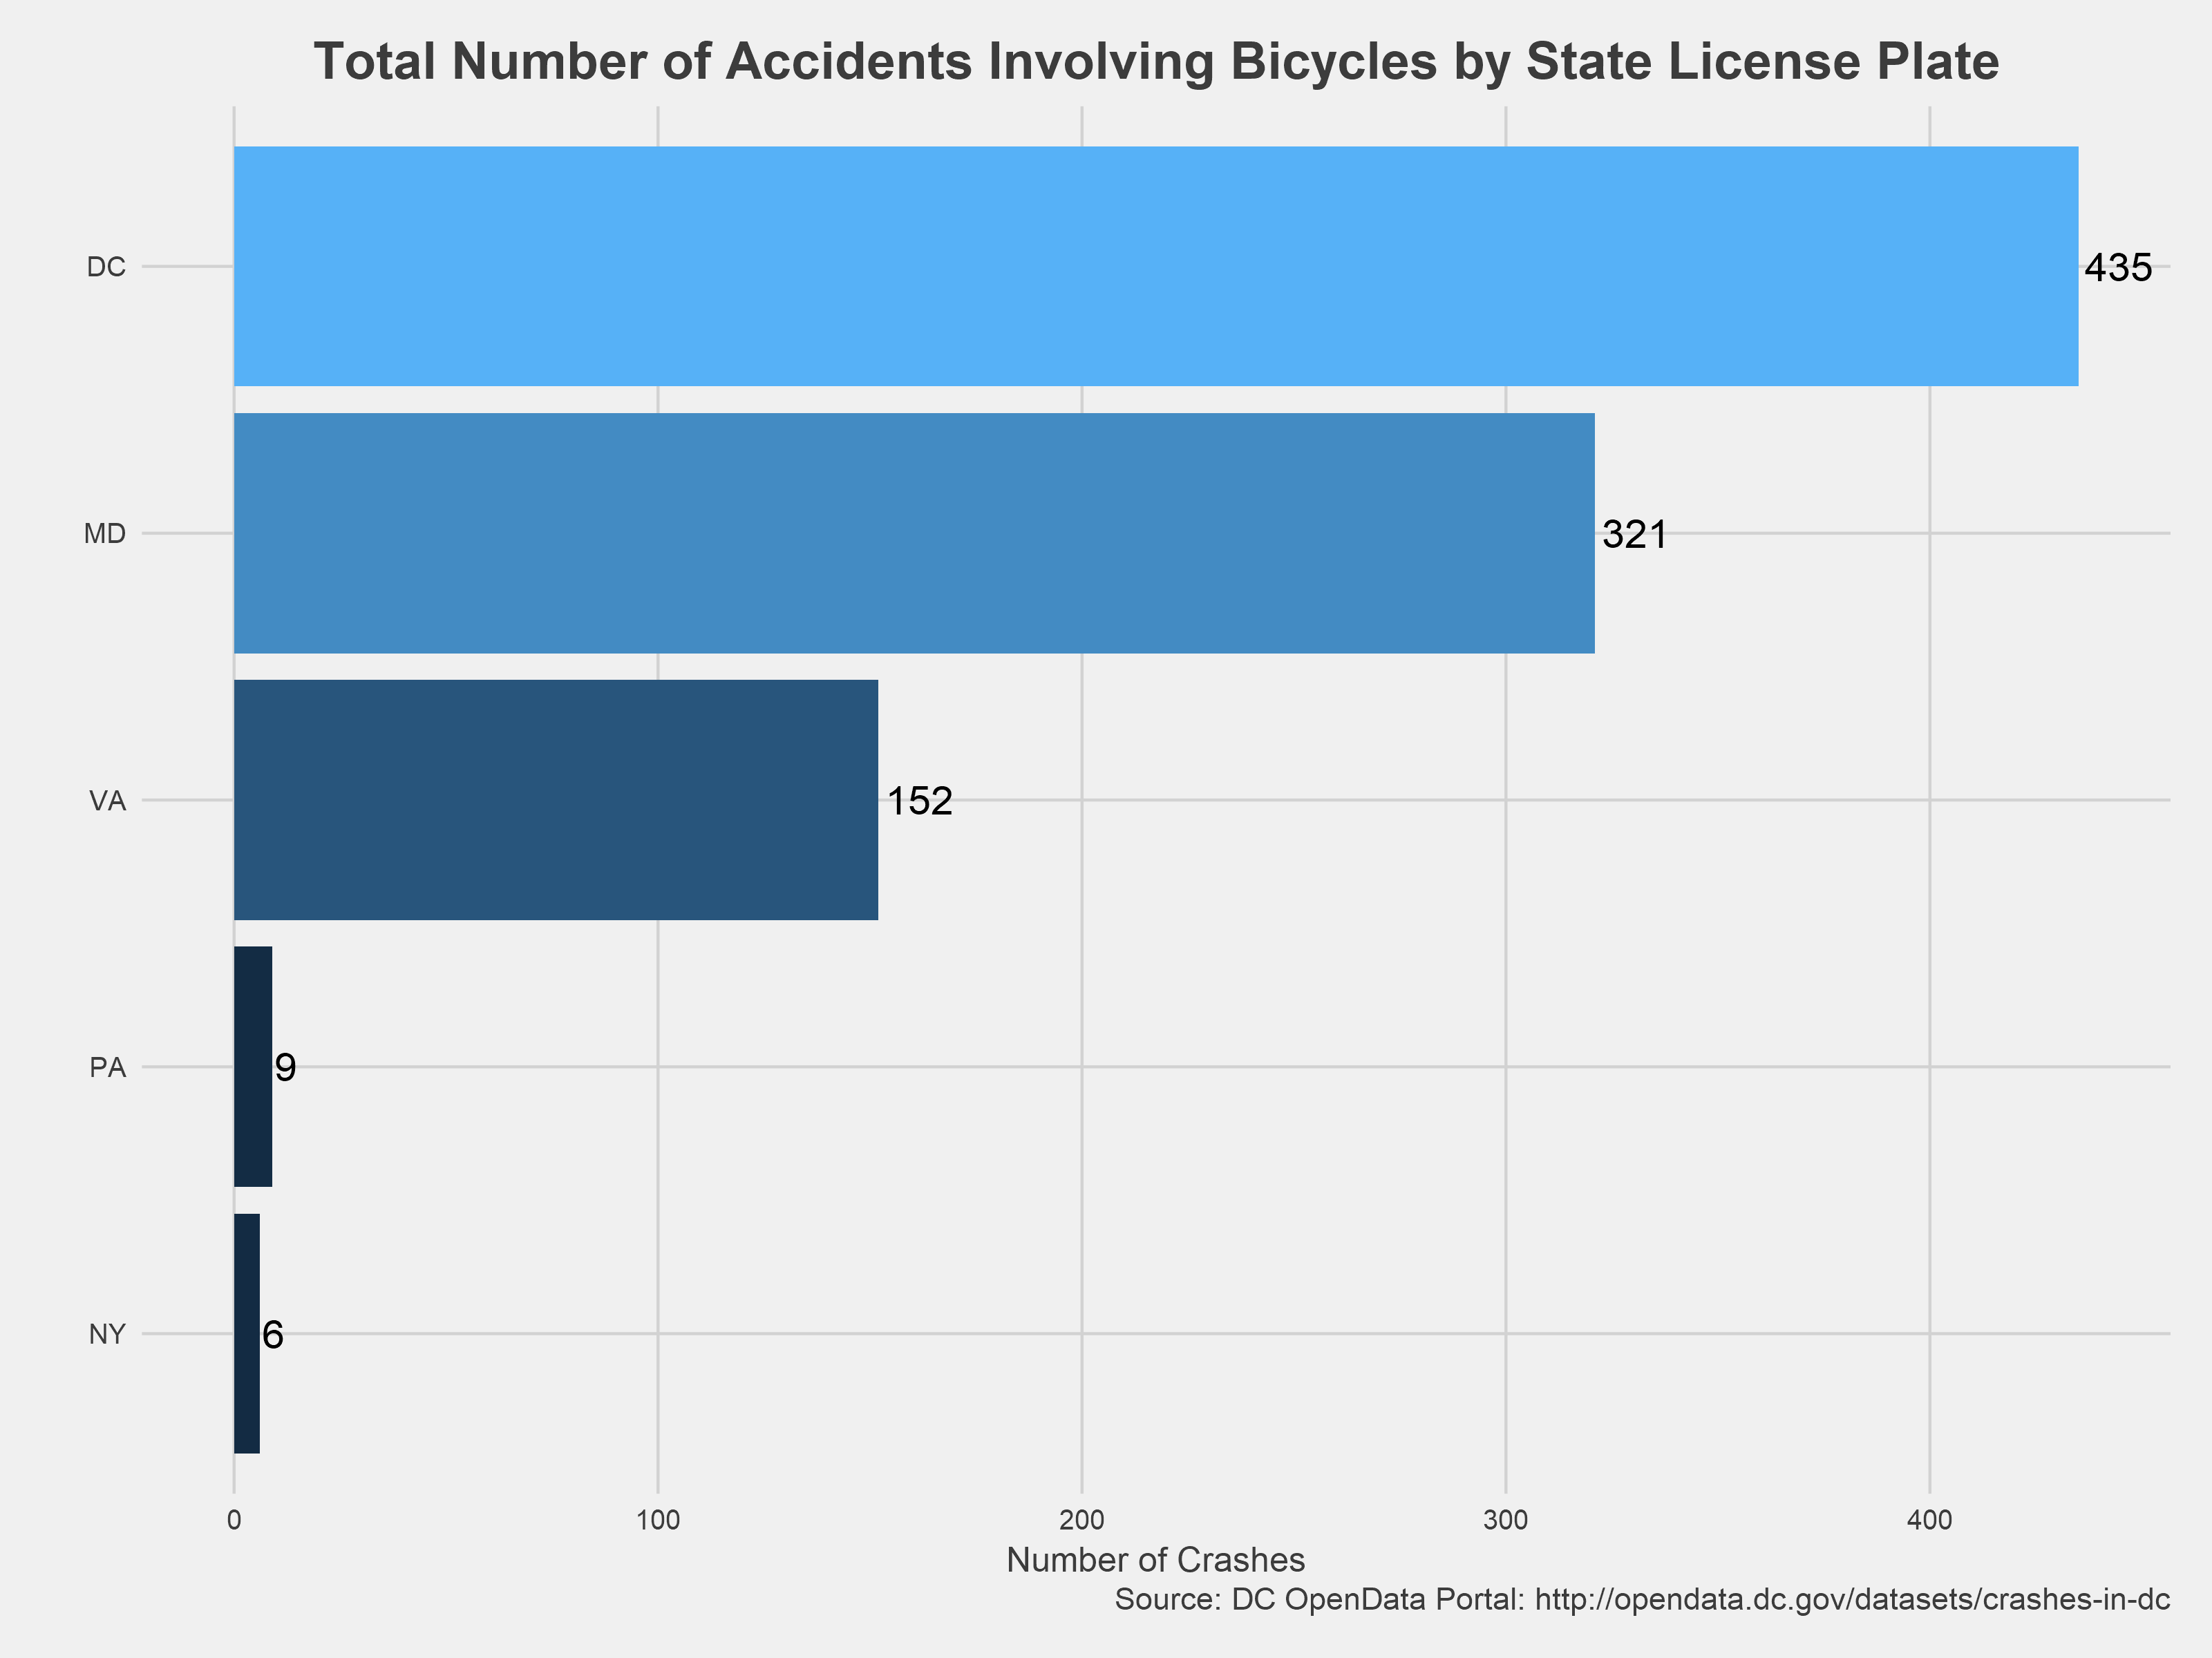
DC drivers account for just under half of the accidents involving cyclists in the district. Maryland drivers also make up a sizable portion of accidents involving bikes - doubling the number of accidents that Virginia drivers are involved with.
Where do the most accidents take place?
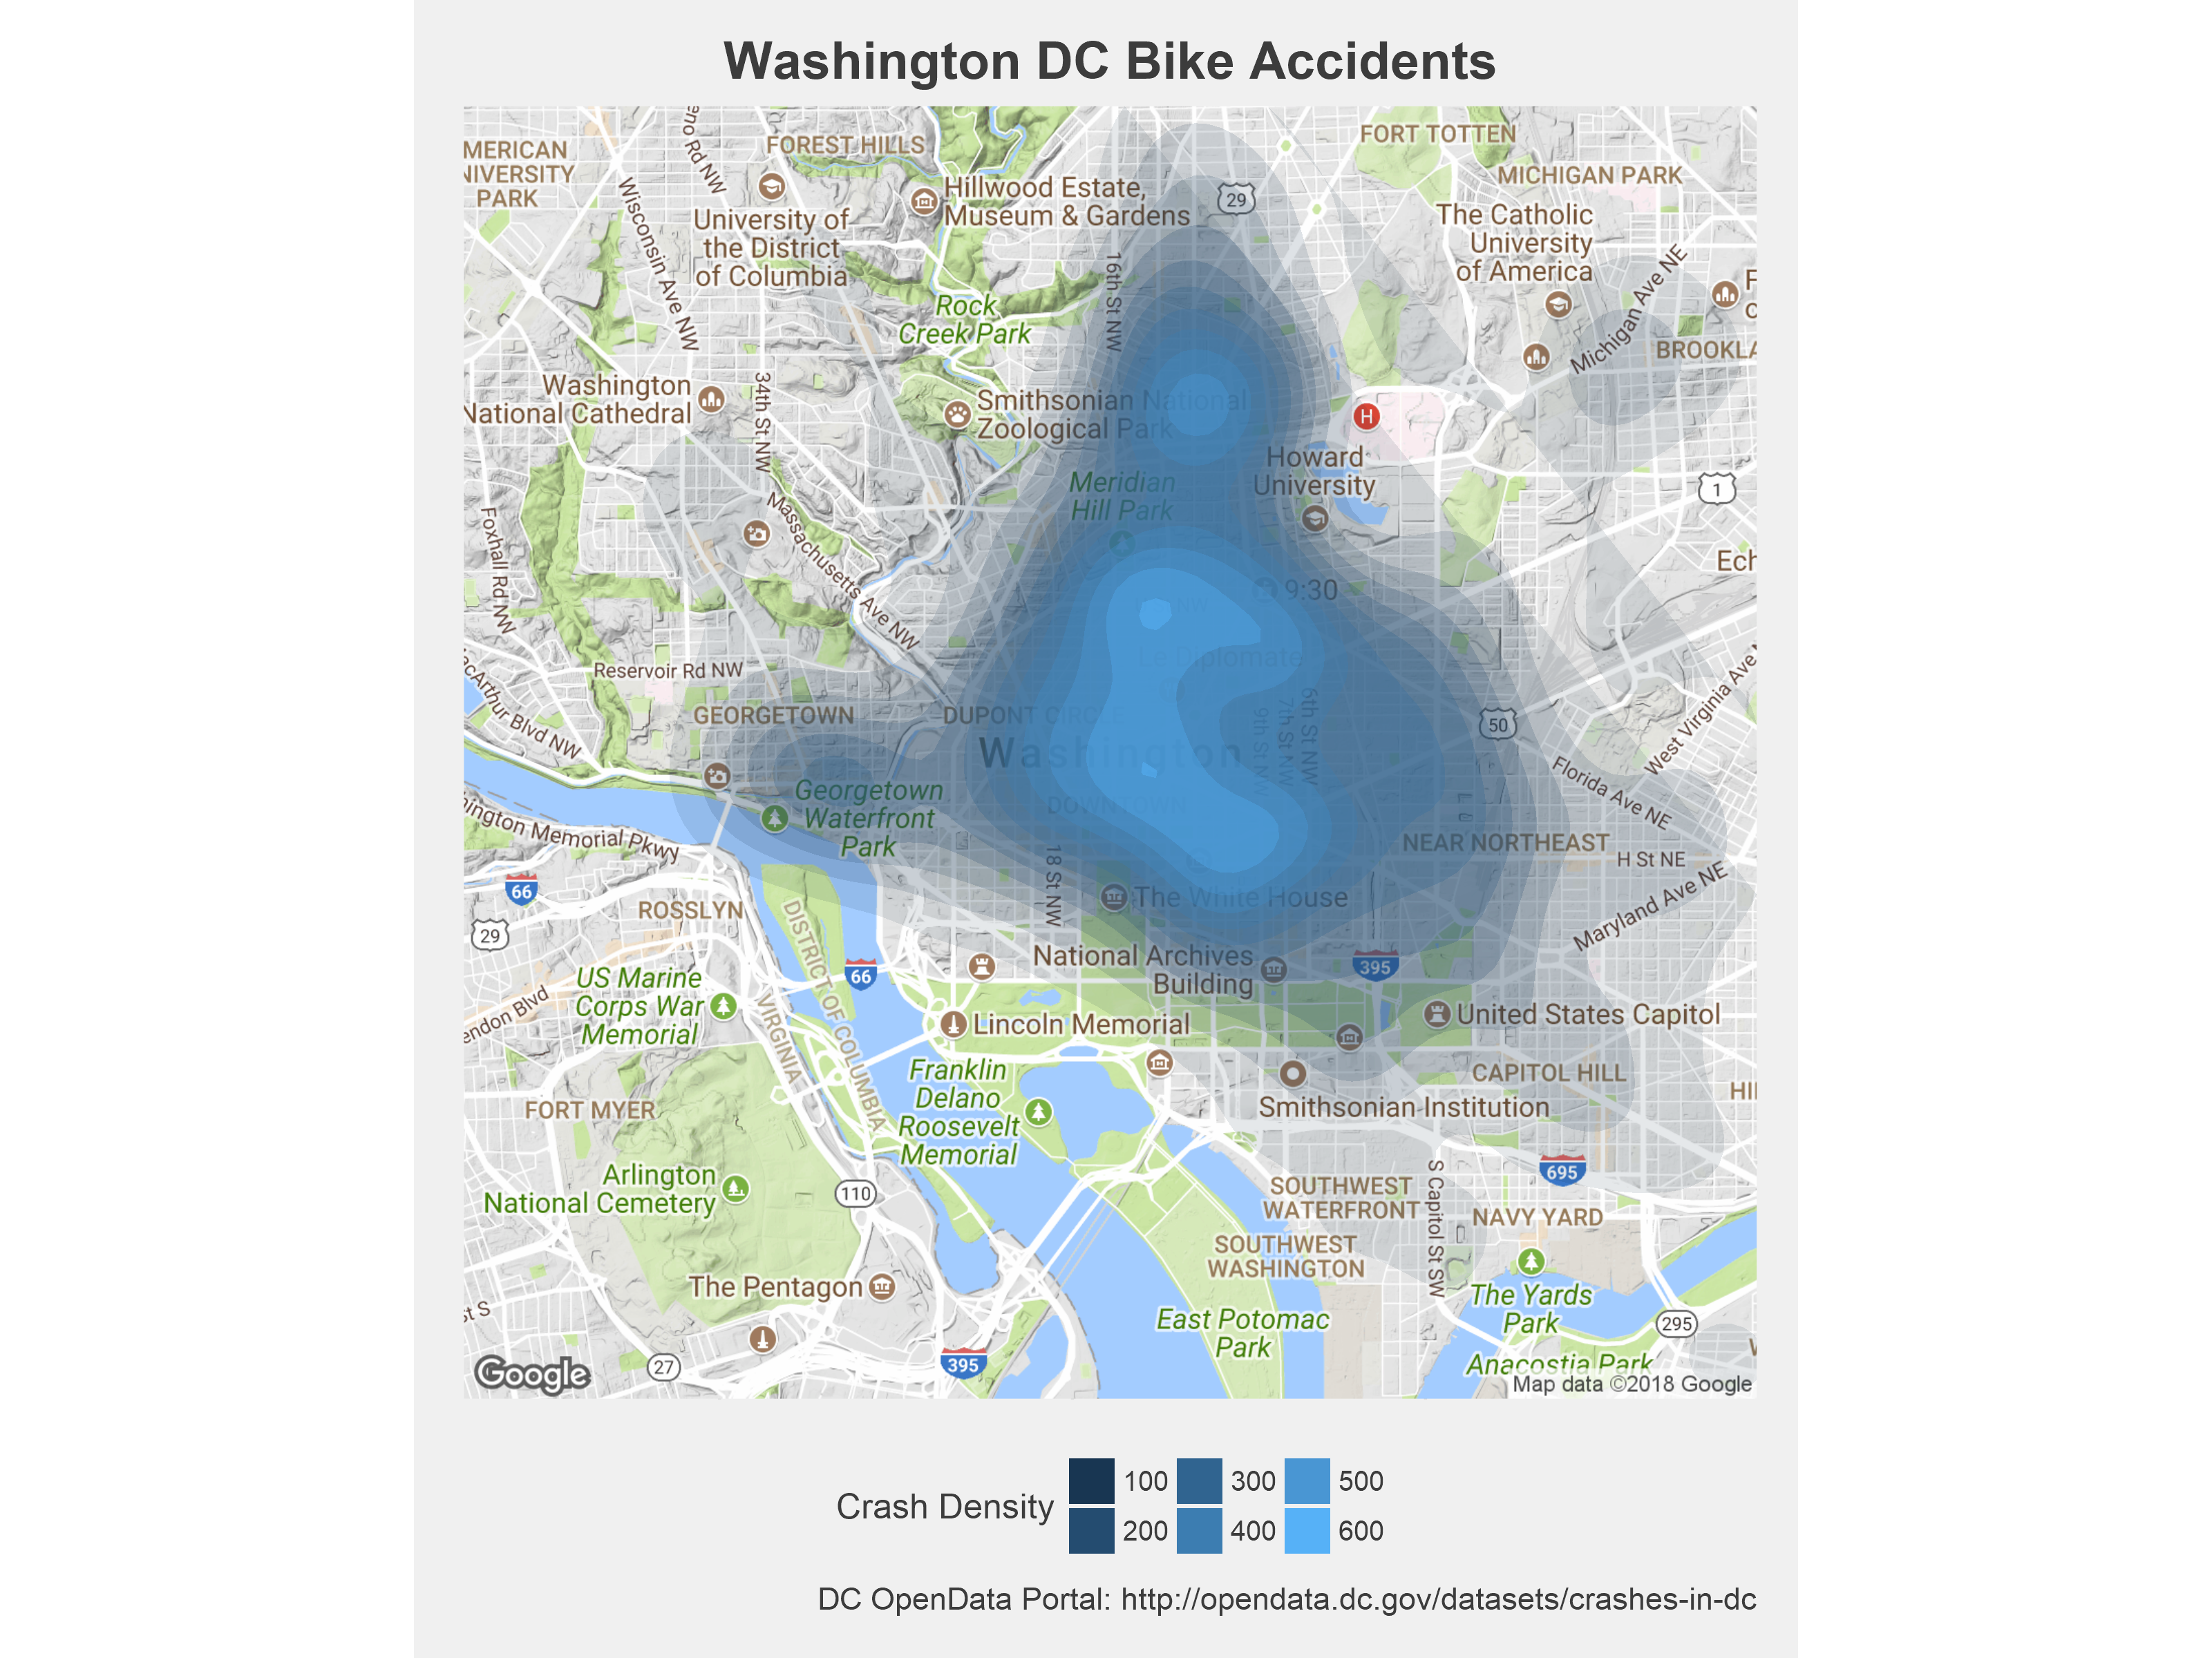
The heat map above shows the density of accidents involving bikes in Washington DC. Not surprisingly, the epicenter of the heat map is in downtown DC, just north of the National Mall and south of Meridian Hill Park. There are also a few other noticeable bubbles in Columbia Heights on 14th Street and Georgetown.
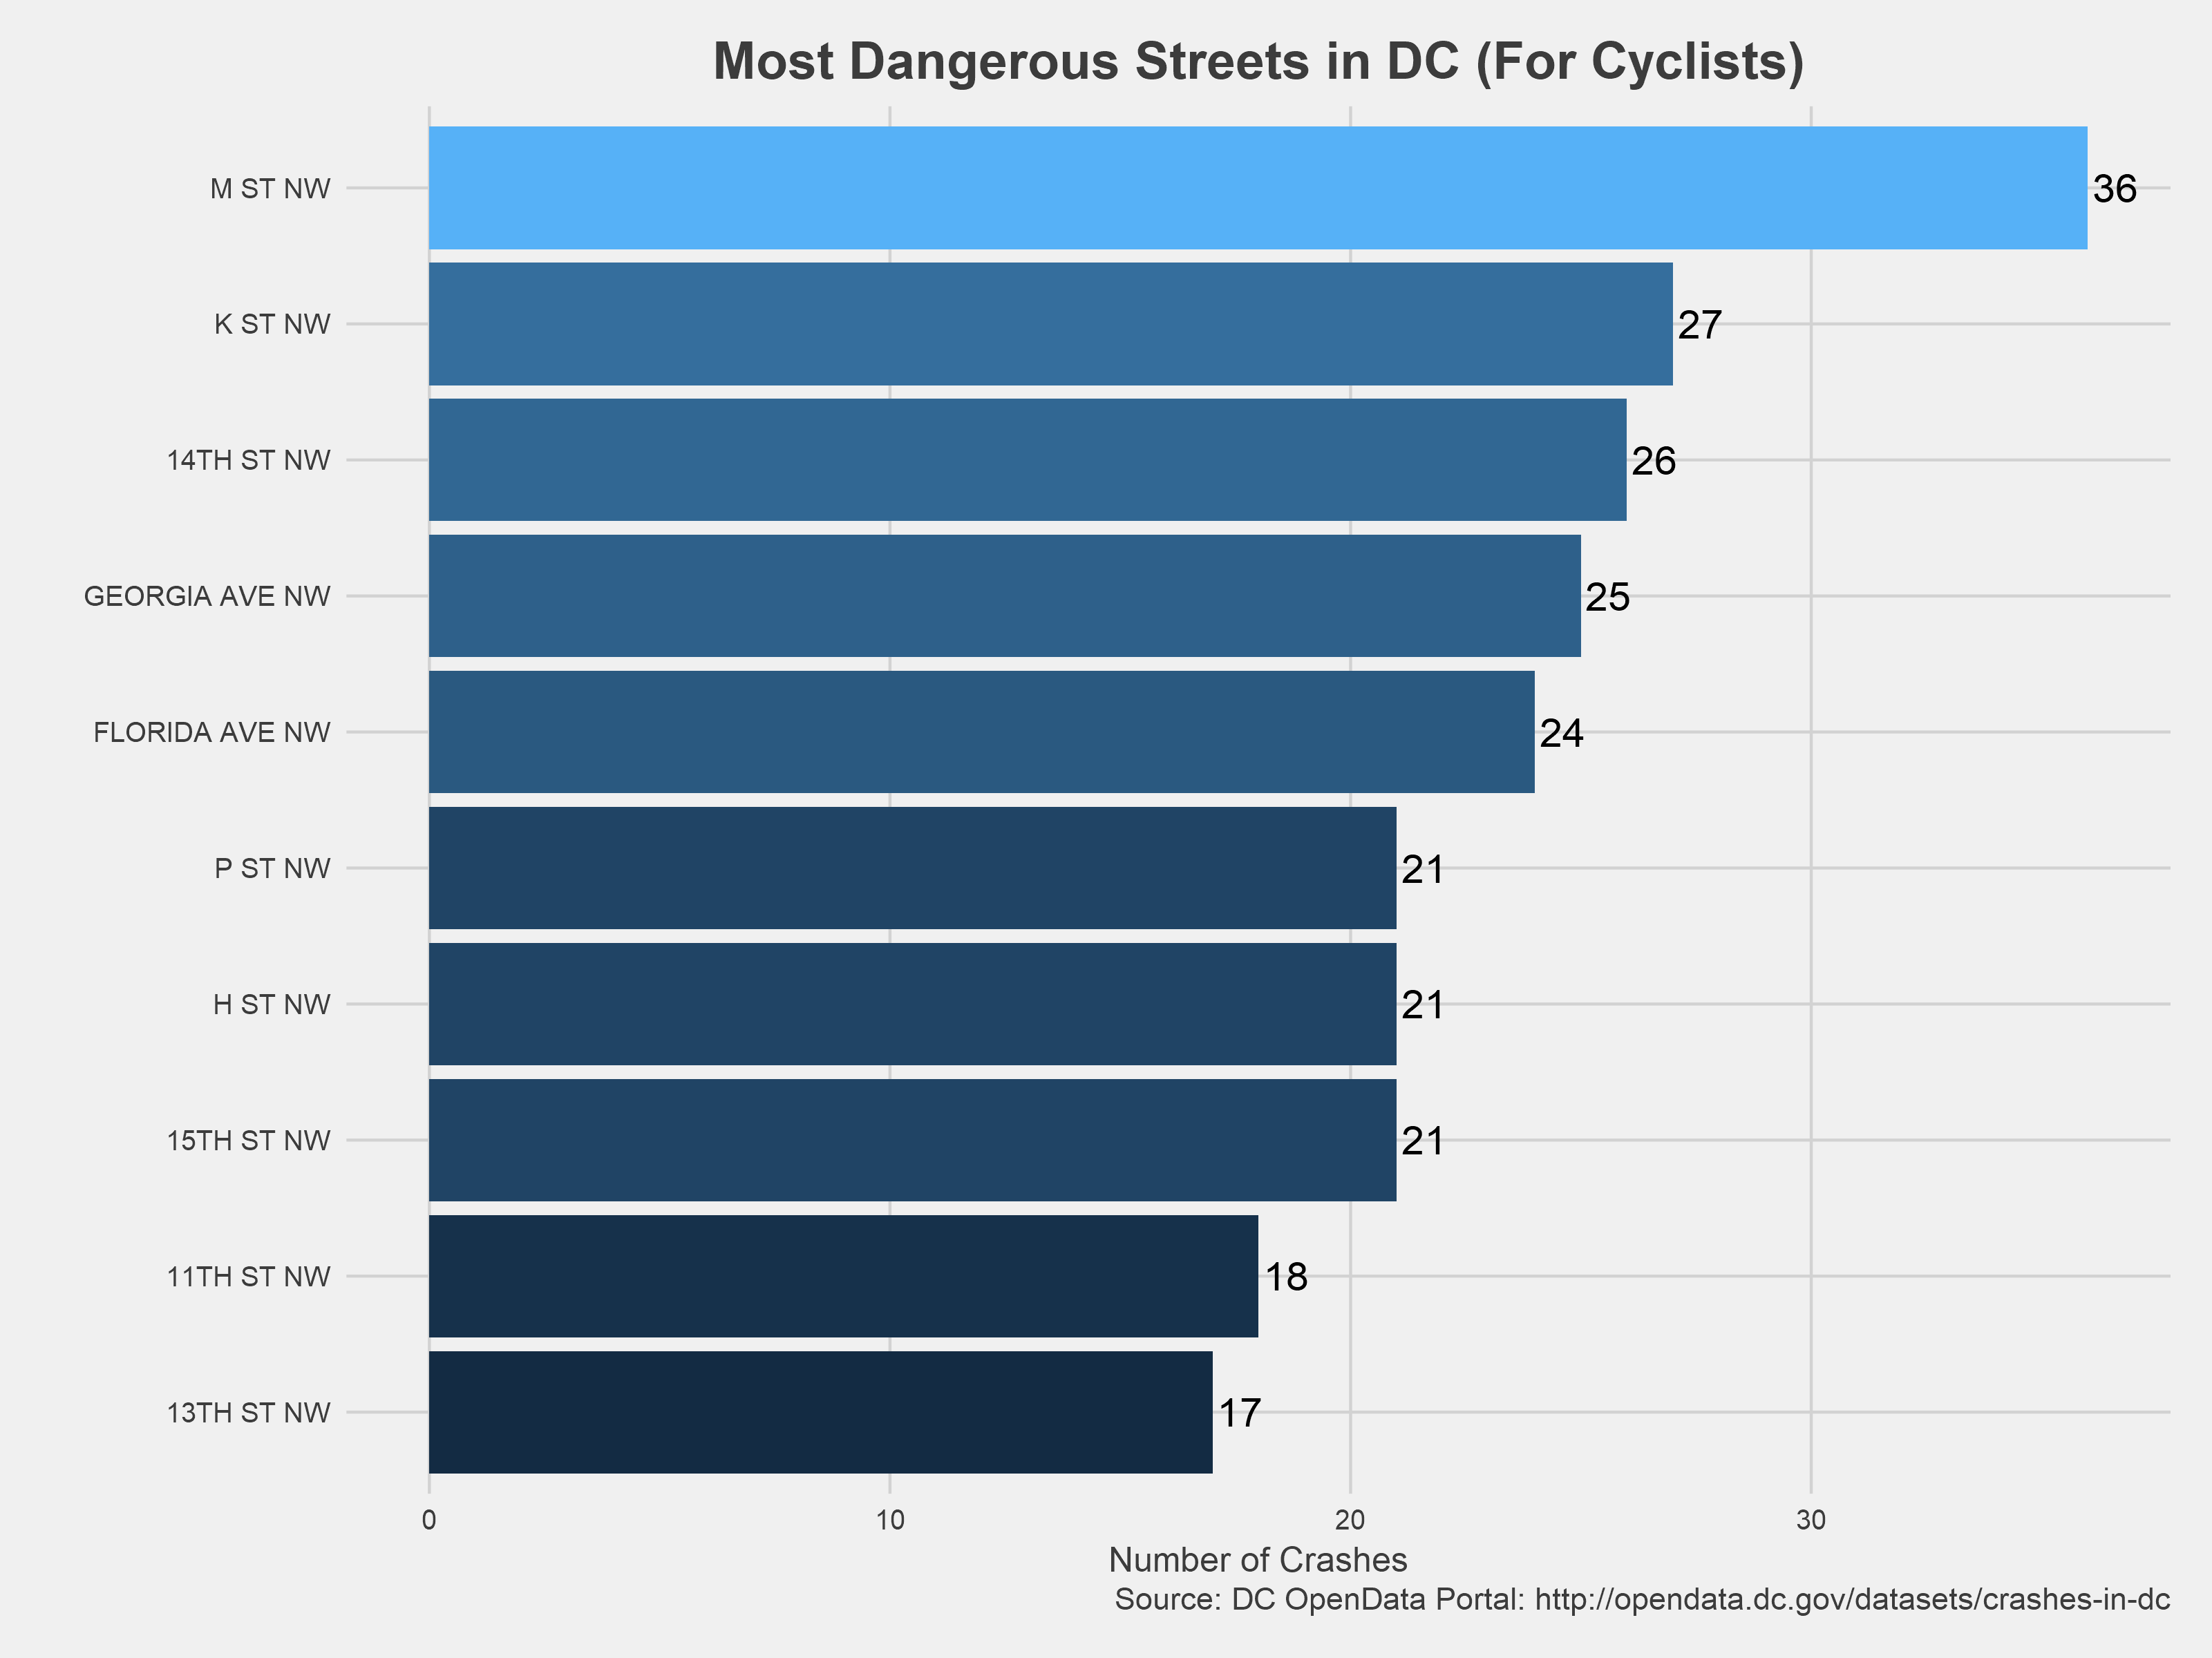
More specifically, M Street, K Street, 14th Street, Georgia Avenue, and Florida Avenue have racked up the most bike accidents. This list tracks with my experiences biking in DC; Georgia Avenue in particular is a pretty terrifying road.
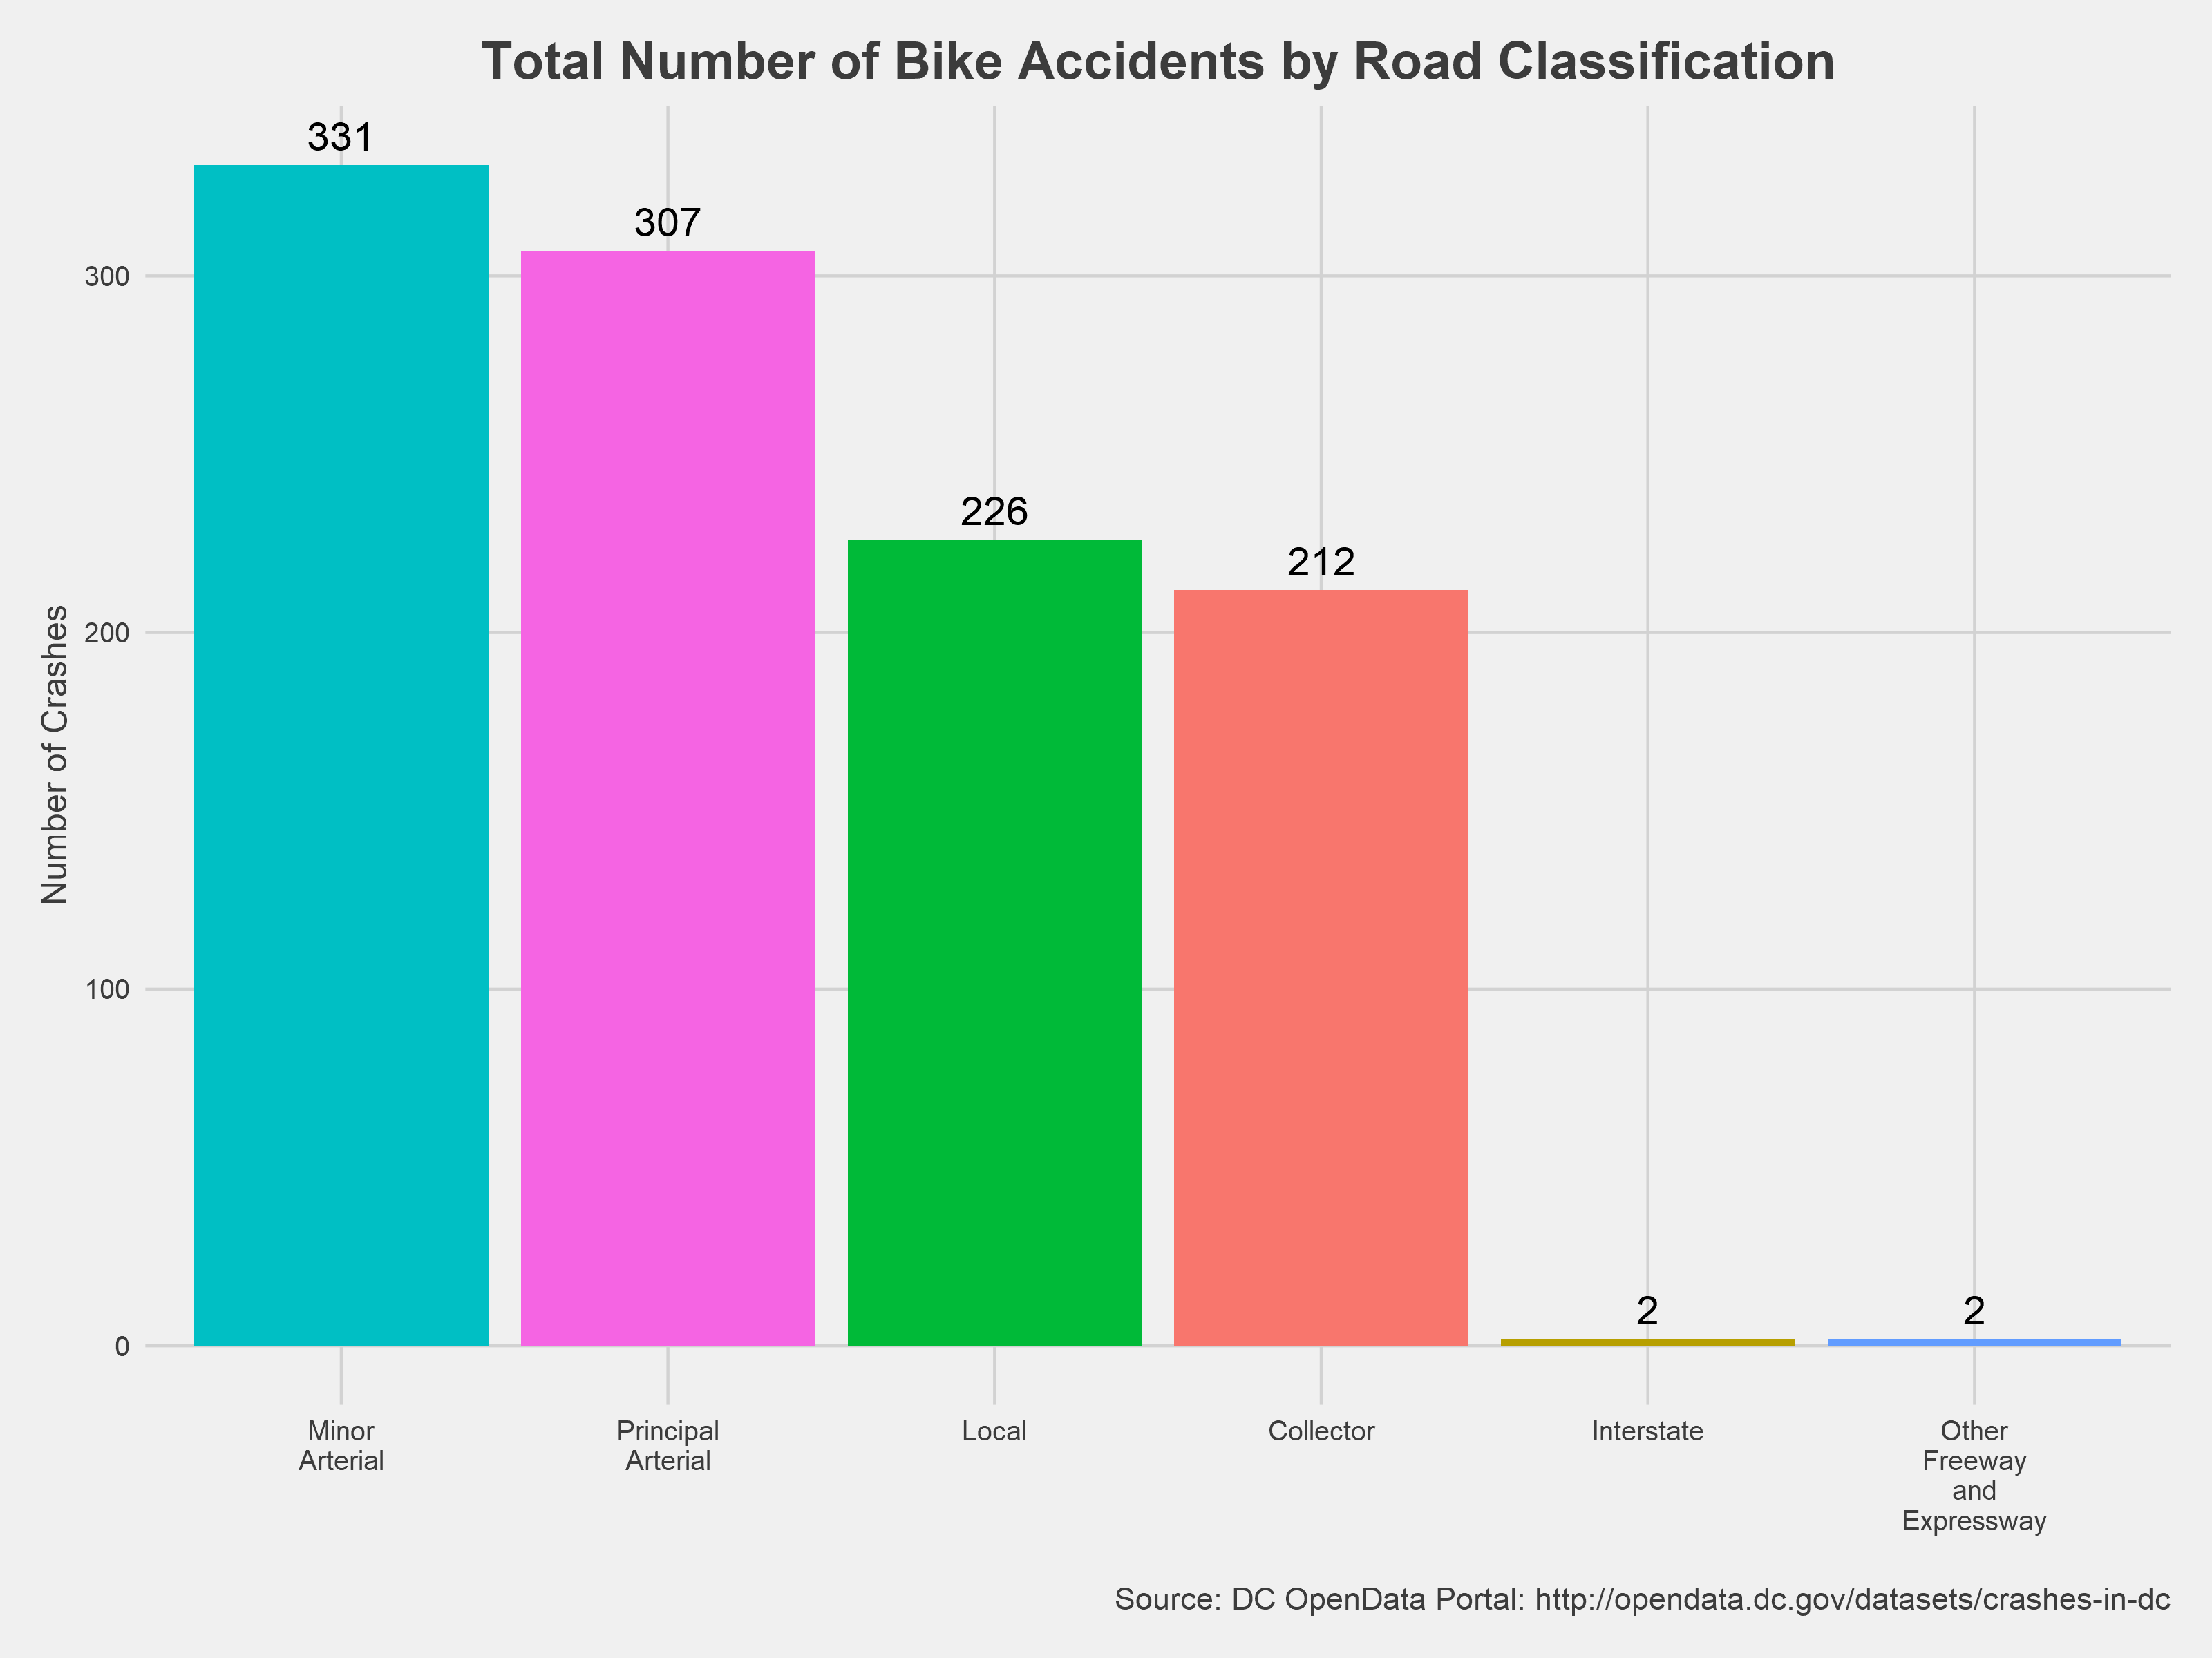
Generally, arterial roads - high capacity urban roads - are the most dangerous type of roads for bicyclists, accounting for half of all accidents in the district. Local and collector roads make up for the other half of accidents. Puzzlingly enough, the Department of Transportation recorded four accidents on interstates and other freeways/expressways.
More information on road classification types can be found here: https://en.wikipedia.org/wiki/Functional_classification
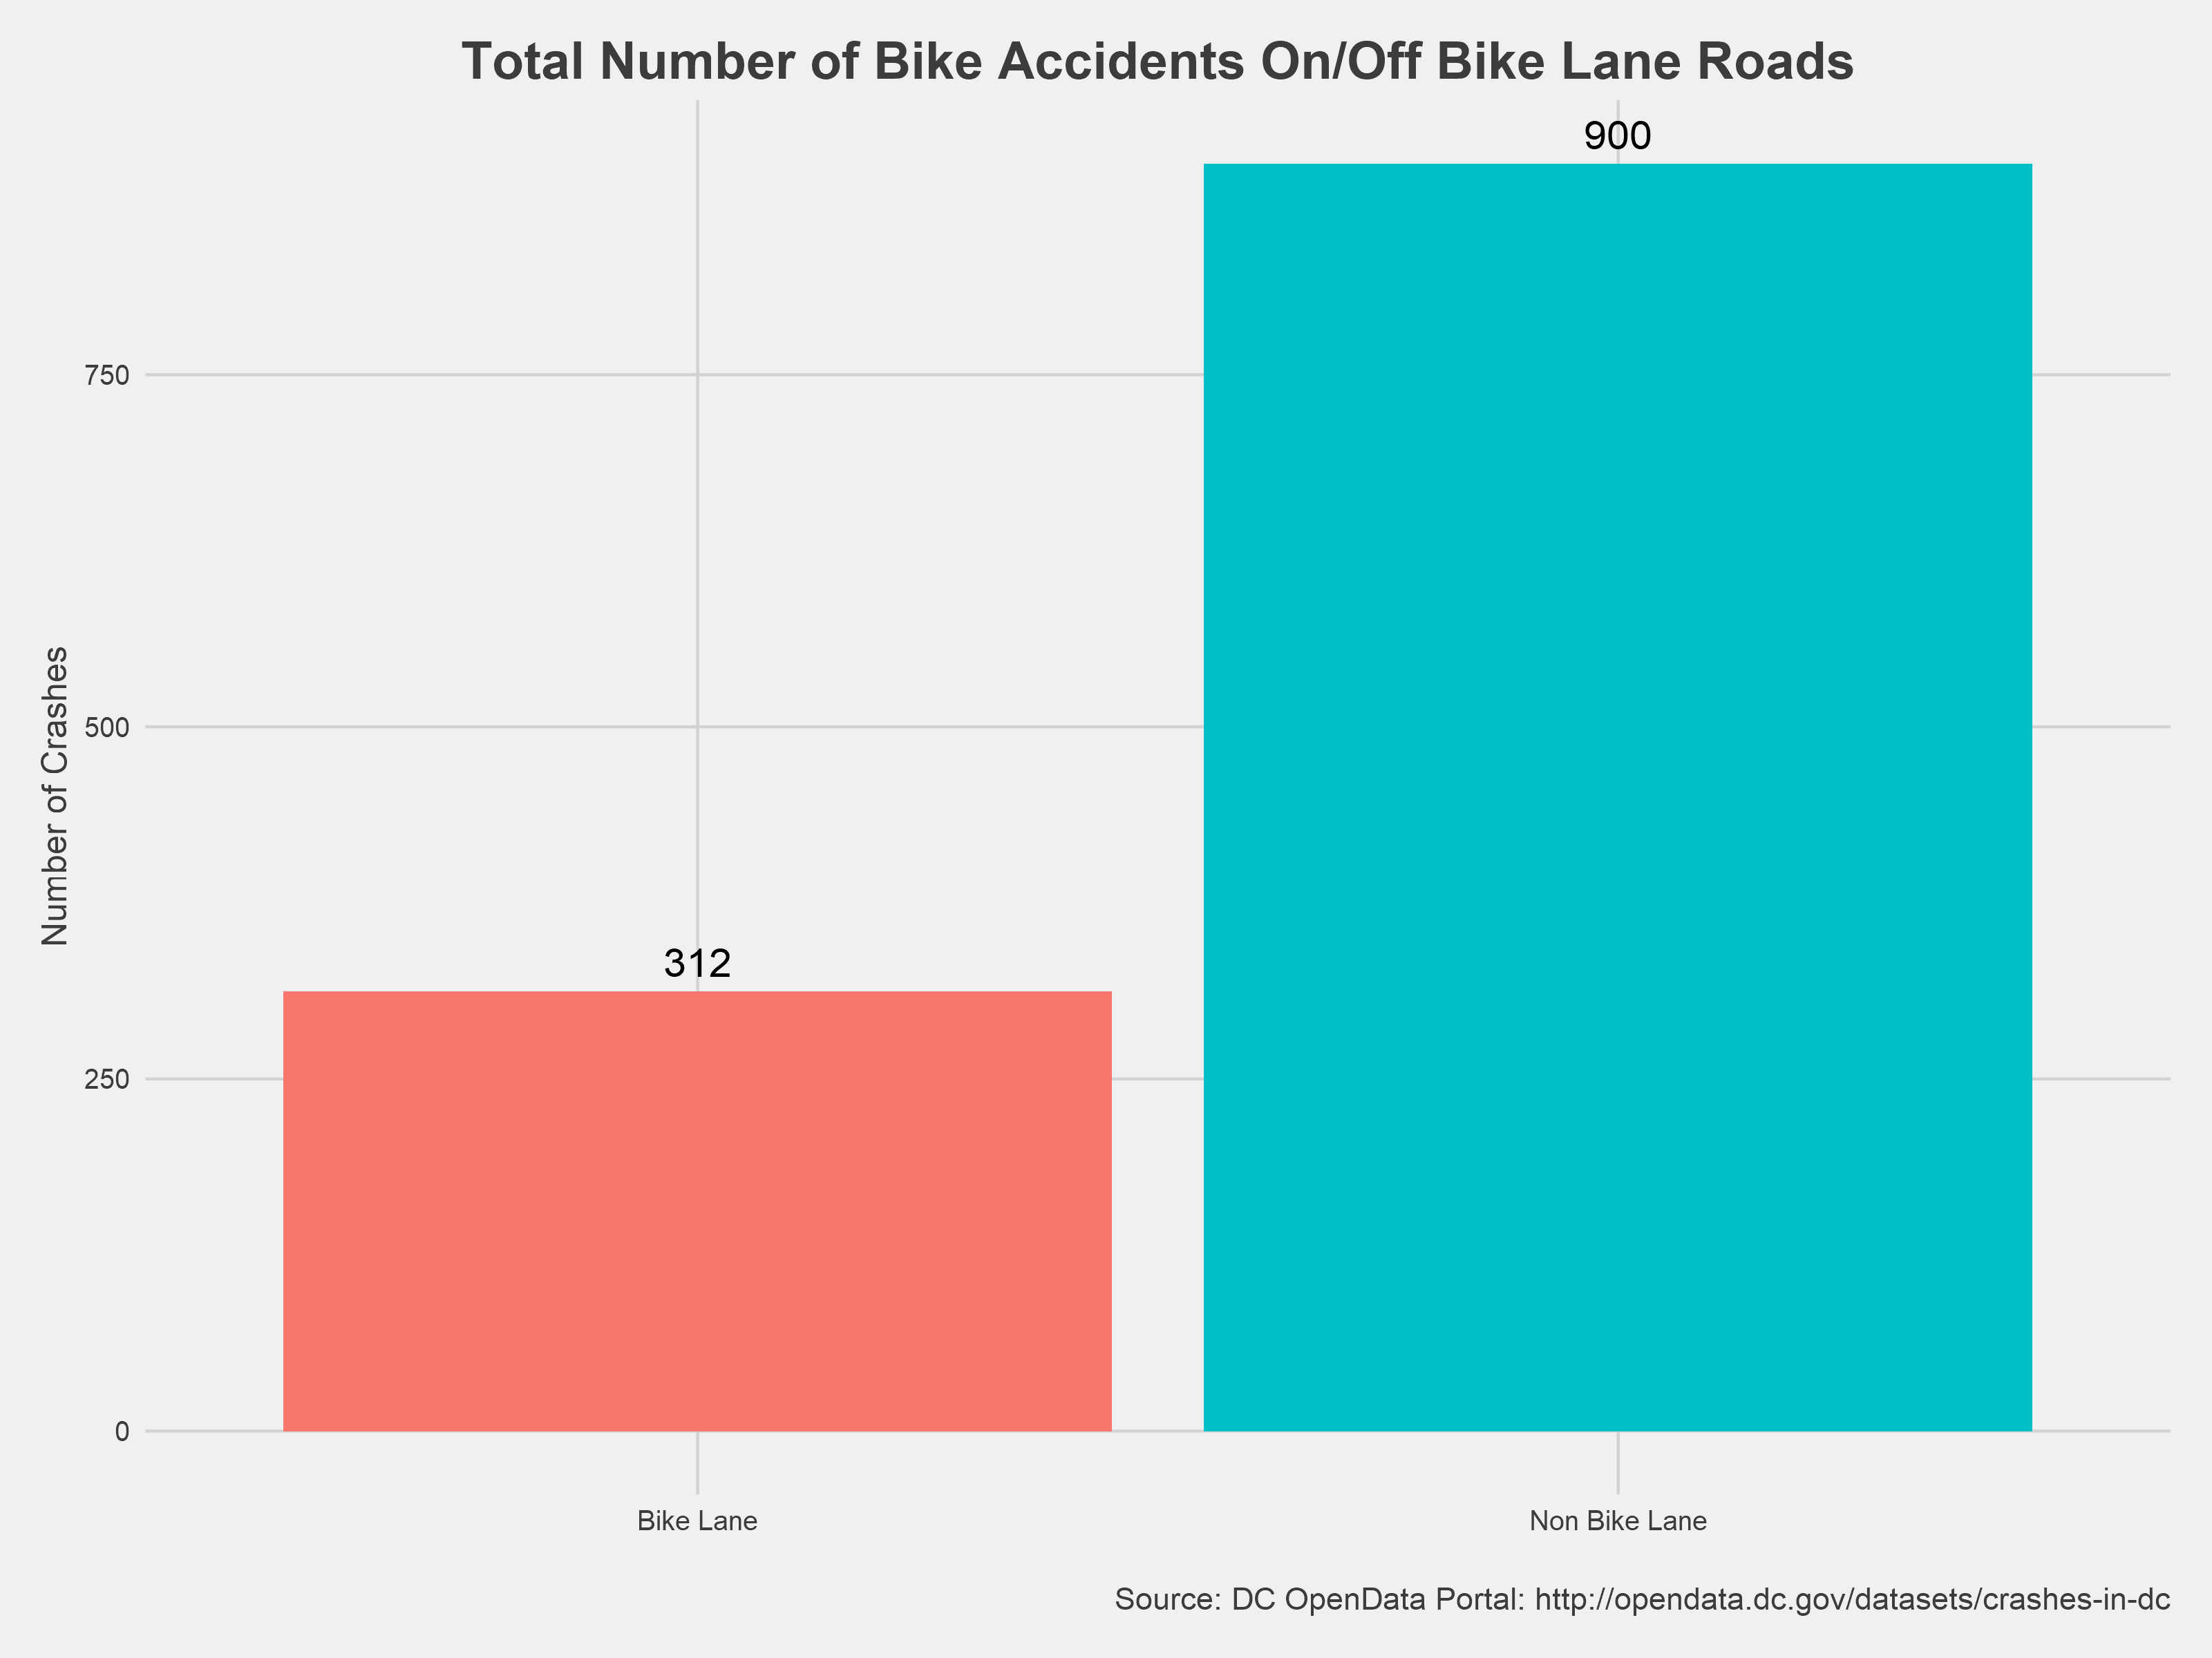
The next question I wanted to investigate is the difference in reported accidents between roads that have some form compared to those with no protection. I was able to merge in street level metadata to the accident level data using bicycle lane & road metadata from DC OpenData. You can see in the chart above that there is a clear difference in reported accidents between roads with bike lanes and those without.
cough, cough build more bike lanes please cough, cough
When do bicycle accidents happen?
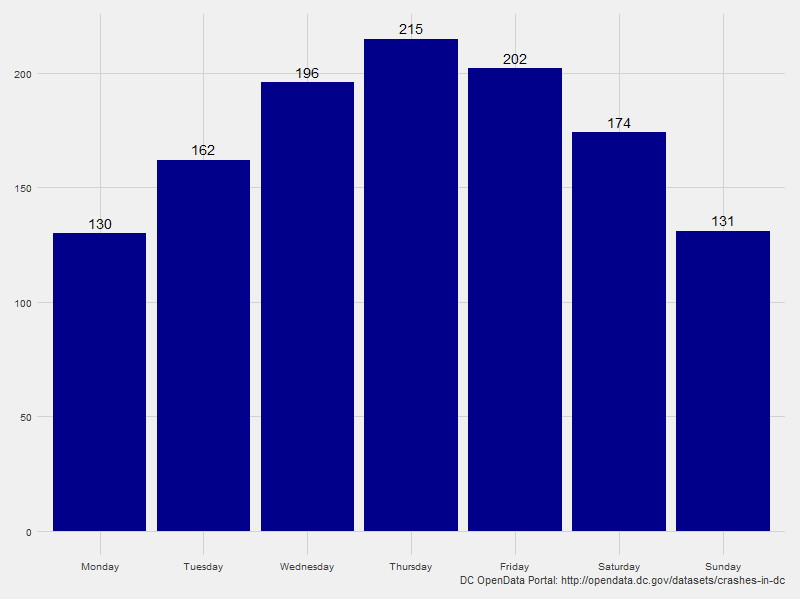
Generally, Thursdays and Fridays have the highest reported levels of bike accidents in Washington DC. My assumption for this is that there are simply more people out and about in the city on their bikes on these days. There’s also a pretty satisfying normal distribution to the number of crashes by day of the week.
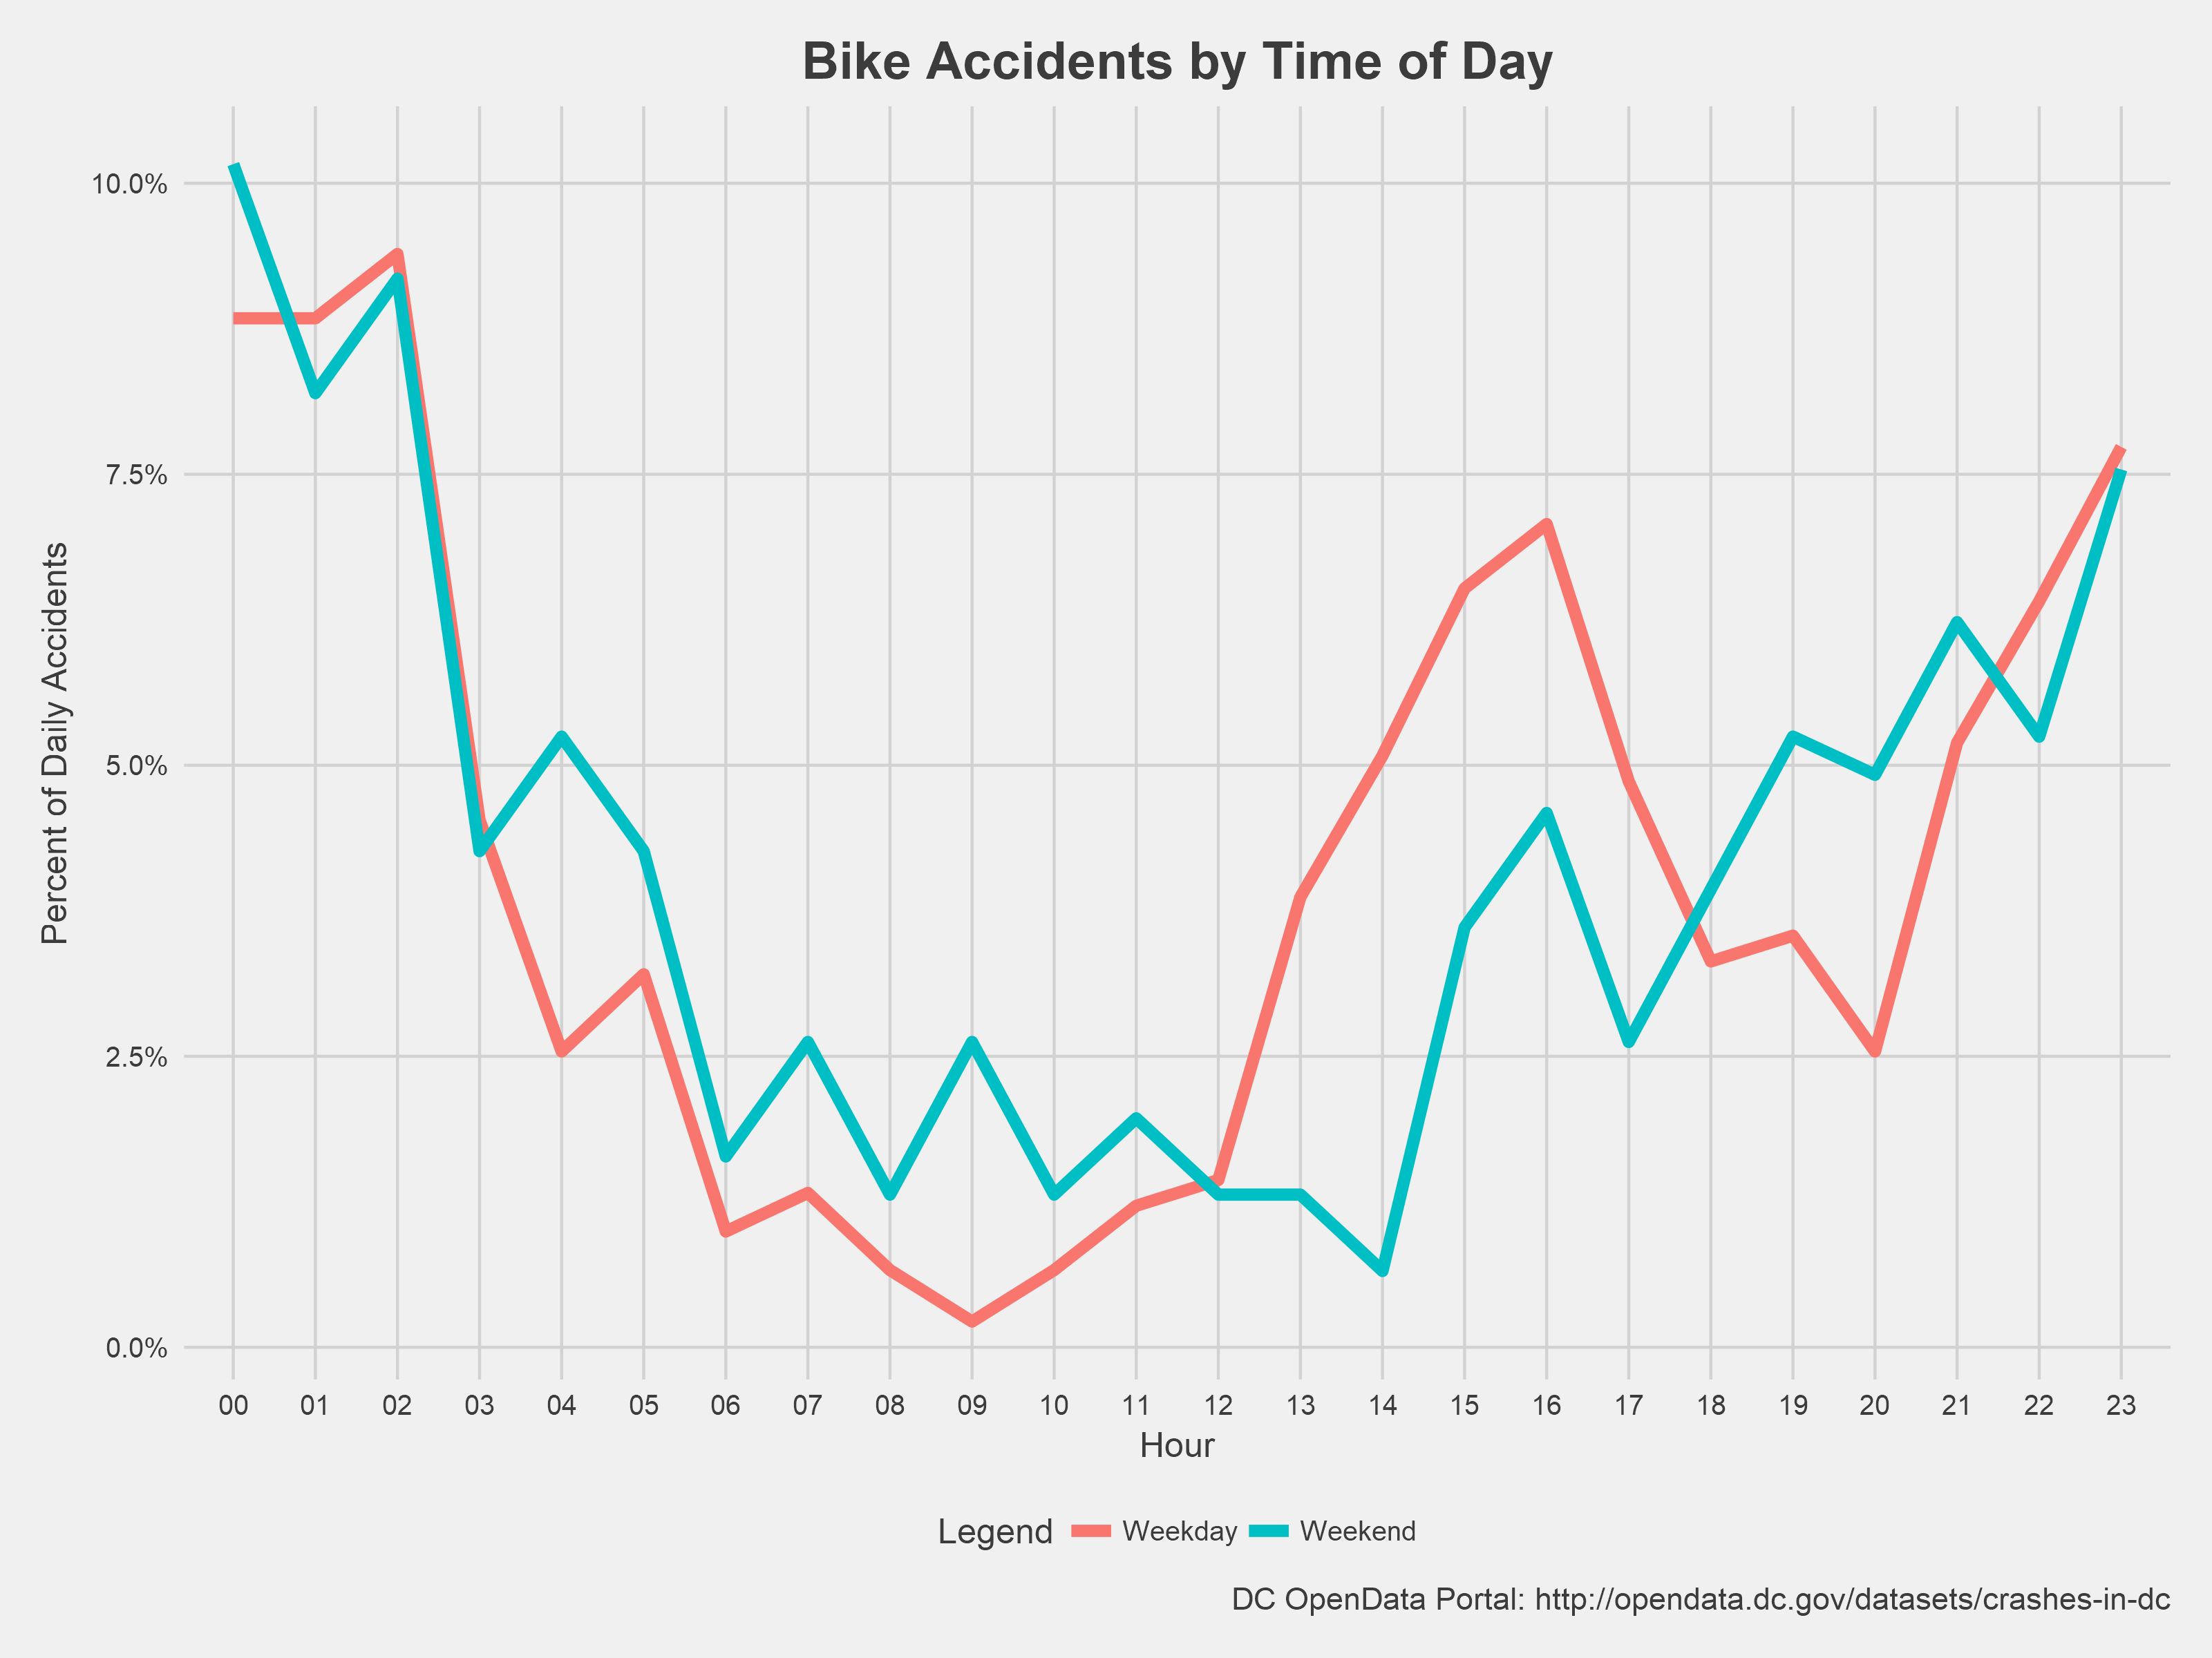
The graph above shows the breakdown of bike accidents throughout the day, controlling for weekends and weekdays. The pattern is fairly similar for weekends and weekdays: the largest percentage of accidents occur after midnight, decreasing until the early afternoon when they begin to rise again. However, the biggest difference between weekends and weekdays occurs in the early afternoon to evening. On weekdays, accidents begin to rise around noon and then peak around 4:00 PM, declining until 8:00 PM. I call this the “dinner lull”: the time after the commuters have gotten home and before they go out for the evening.
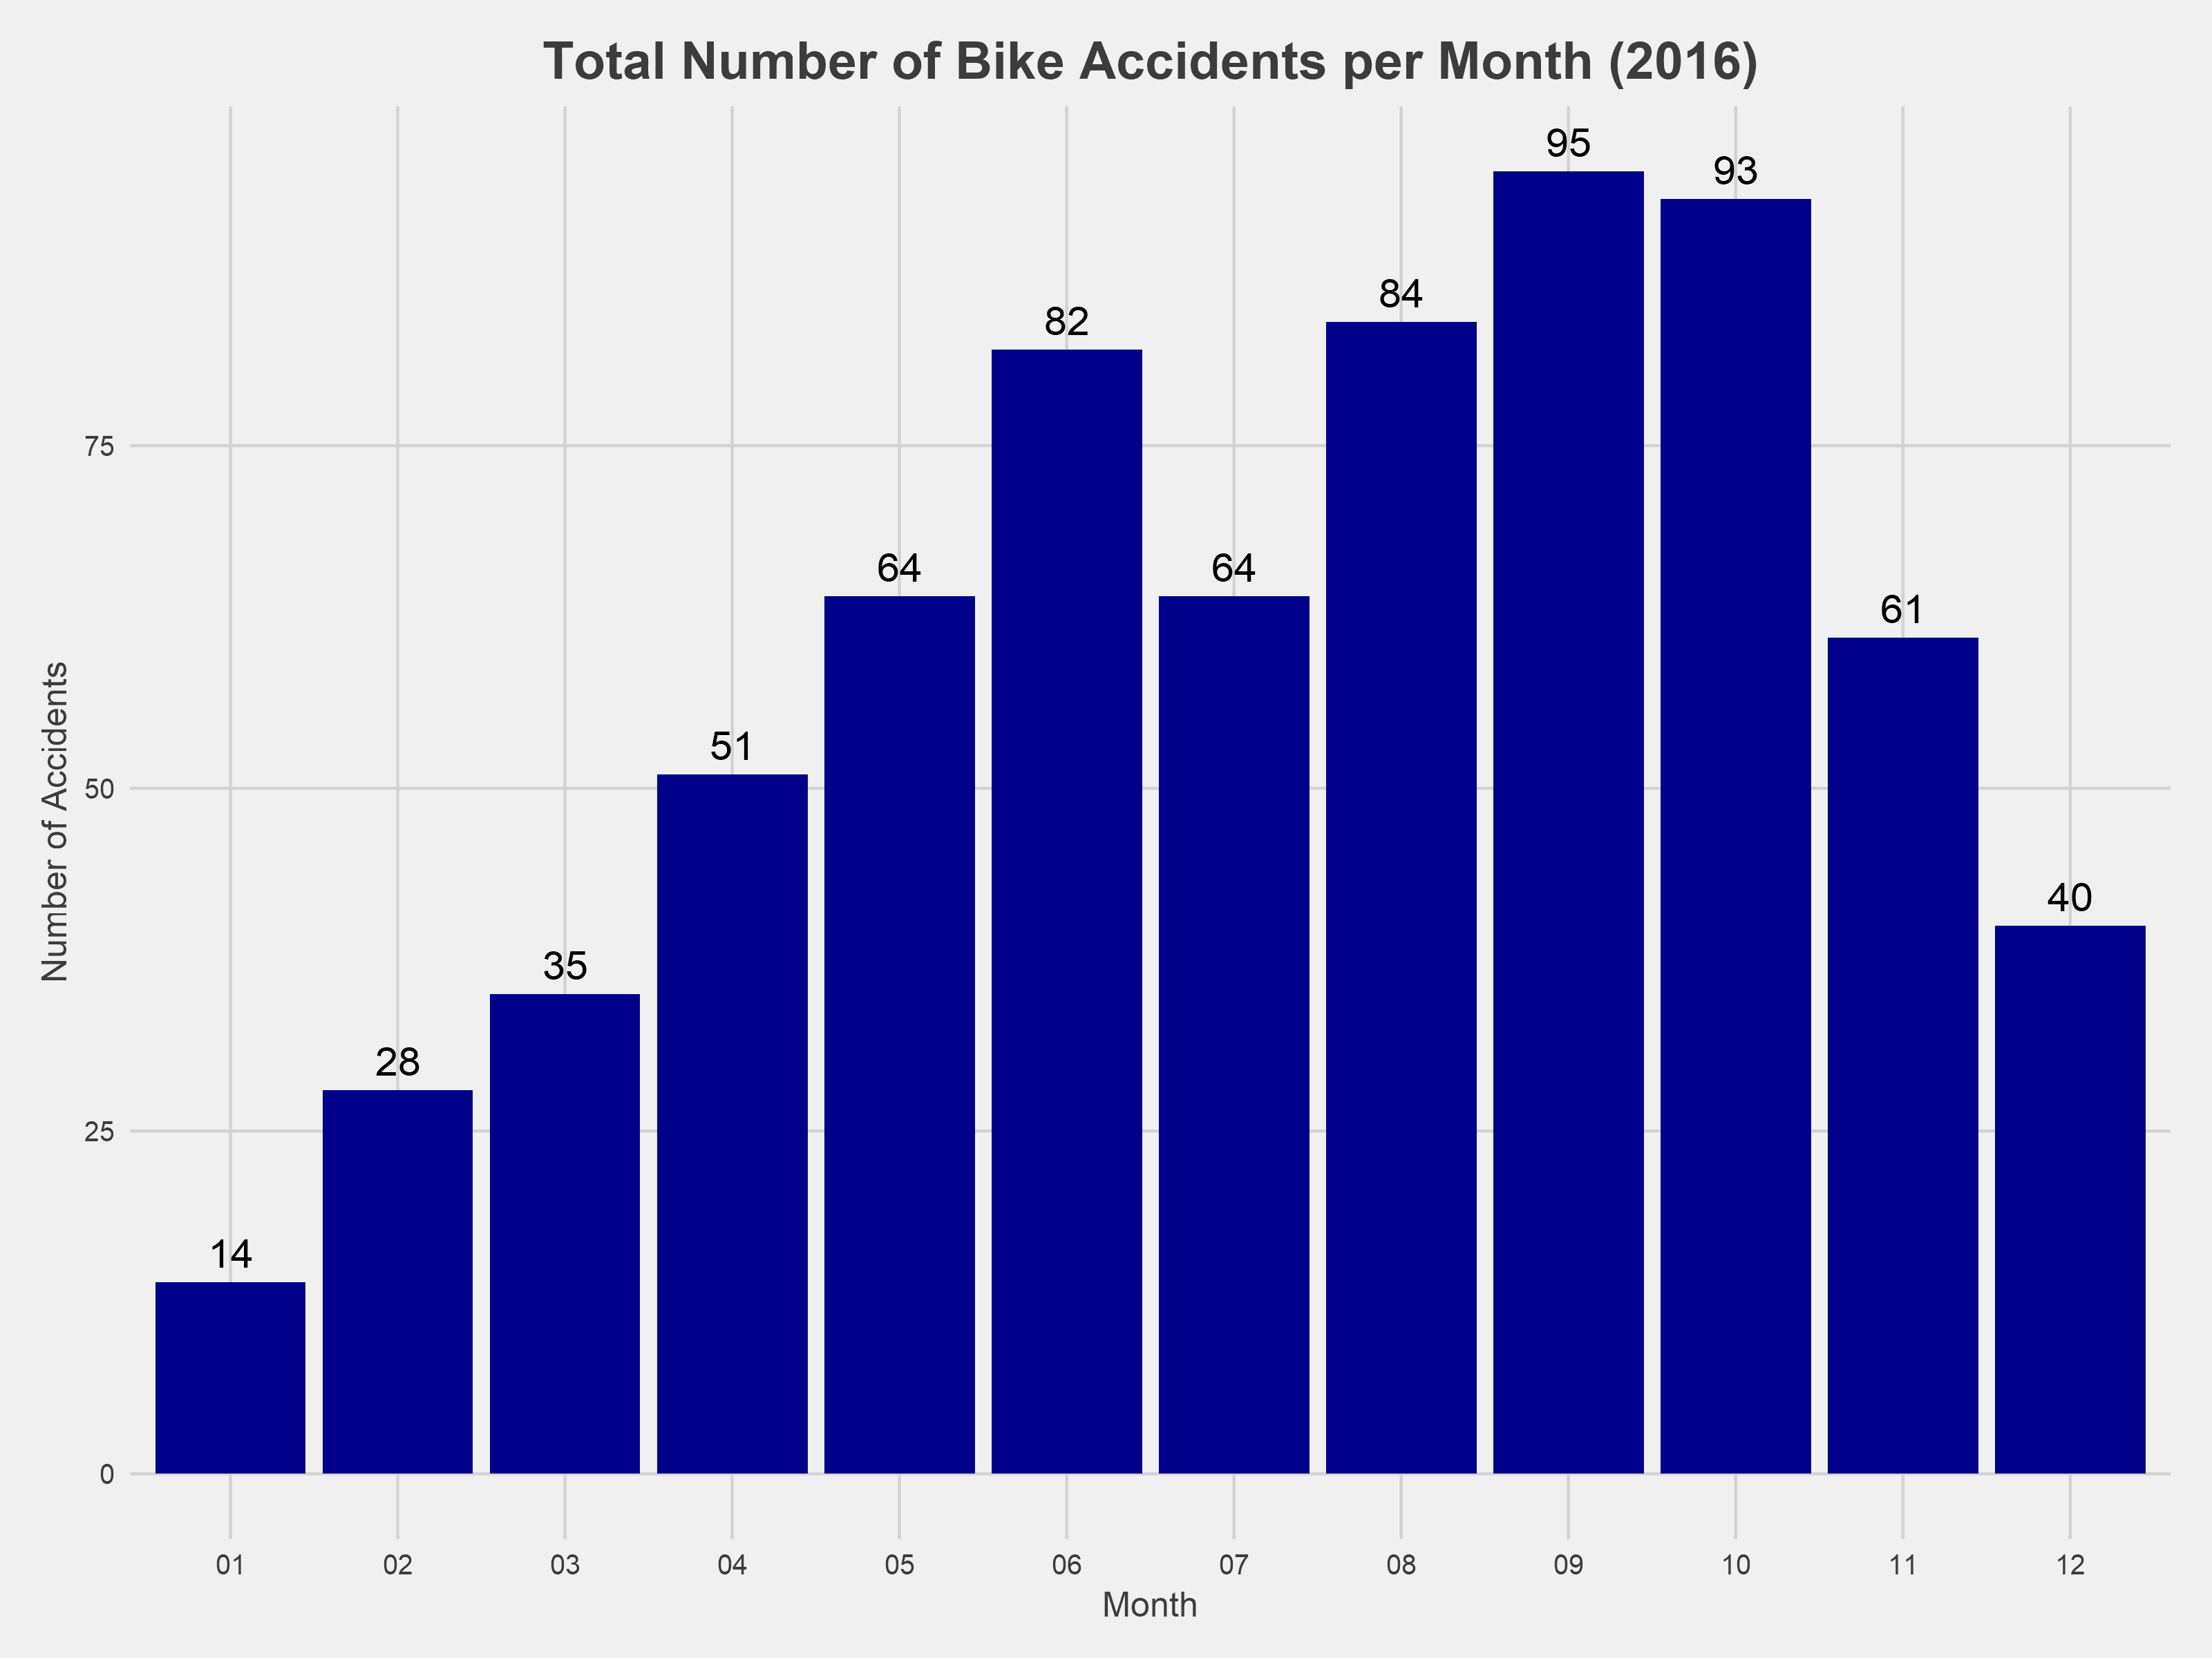
Turning to look at the number of bike accidents by month, we see that the distribution is quite left skewed, more so than I previously imagined, with the highest number of accidents in September and October. I expected the number of accidents to follow the distribution of total number of bicyclists. More simply, the warmer the weather, the more people on the road, and more accidents. However, the accident data tells a different story.
Is this a result of less people biking during these hot summer months, or is it actually safer to bike in the summer time? OR are there more accidents that are going unreported to the Department of Transportation during this time? In order to answer the first question (the second requires an understanding of the DDOT’s reporting system), we need to get a sense of overall ridership patterns.
Note: I filtered the accident data for the subsequent monthly analysis to only 2016 because there appears to be some lag in the 2017 reporting that was skewing the data
We can get a general sense of ridership patterns using Capital Bikeshare data. Capital Bikeshare is a subscription-based bike sharing service in Washington DC that lets users rent bikes for a given amount of time before returning them to a number of docks throughout the city.
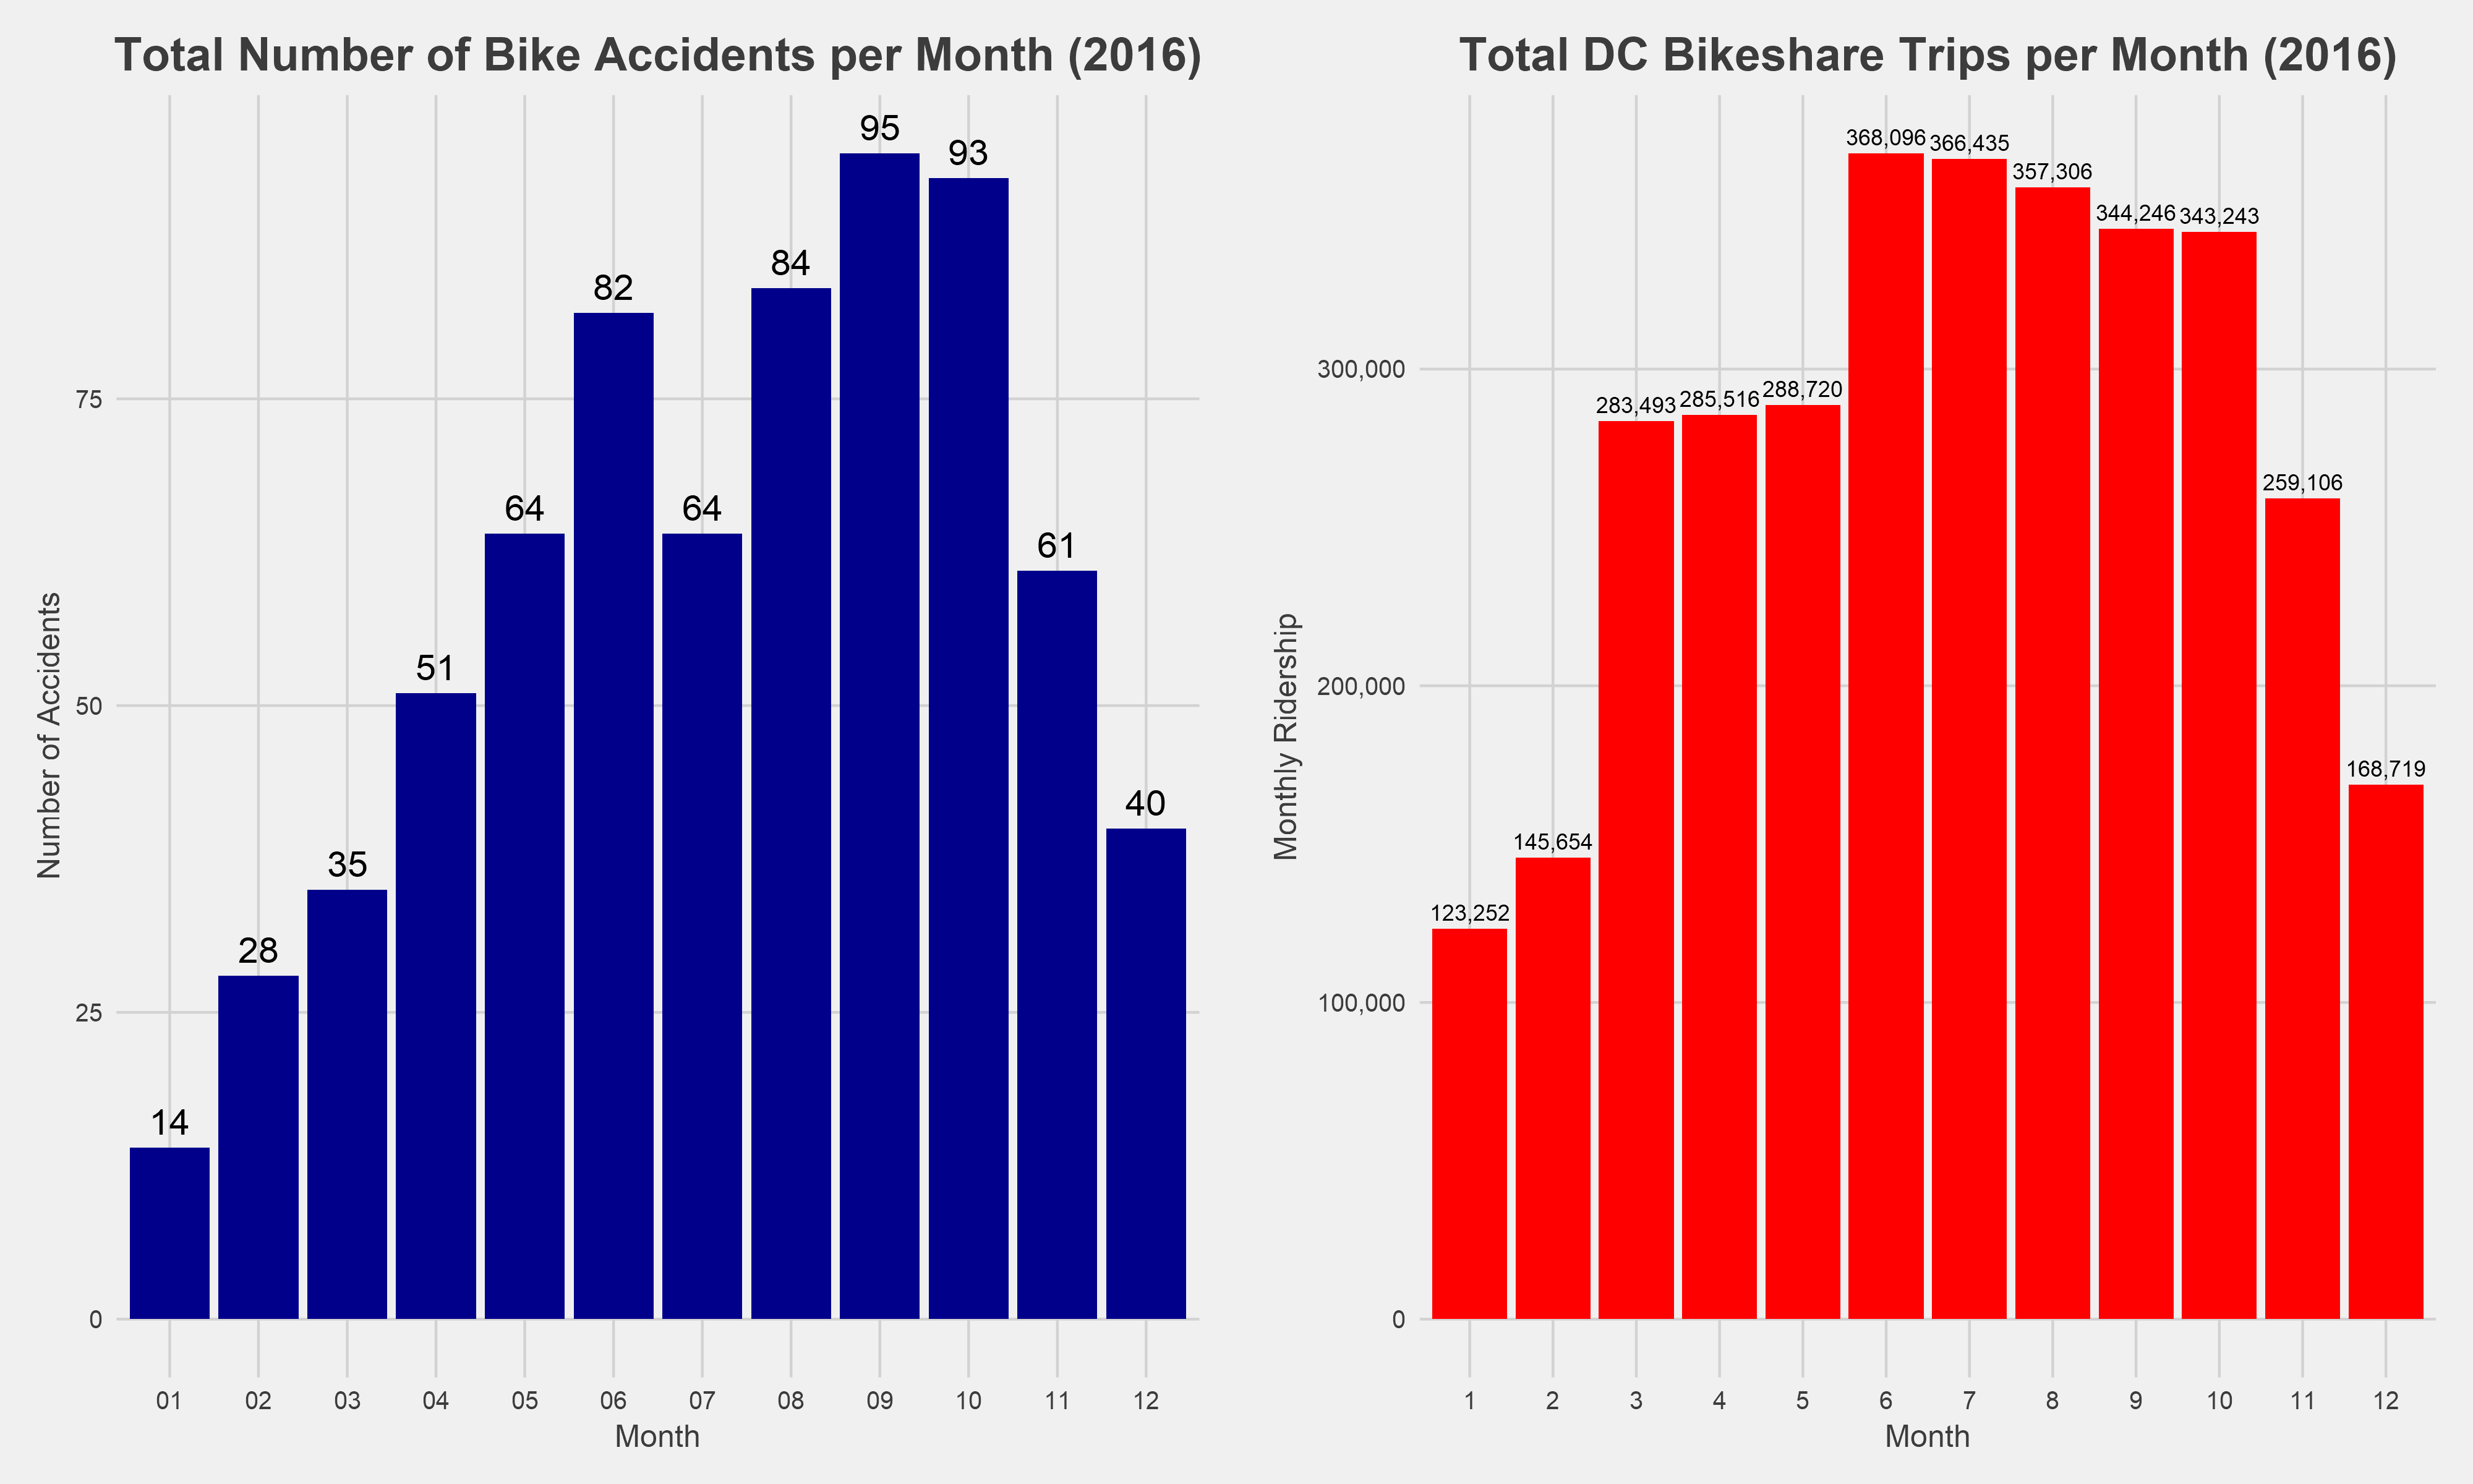
The ridership data shows the pattern I previously expected: the peak bicycling months for DC Bikeshare are July and August. It is important to note that DC Bikeshare riders =/= all cyclists, so we have to be careful making connections between the two. However, despite having the highest amount of DC Bikeshare riders on the road during this time, the summer months had lower numbers of reported accidents than the fall months.
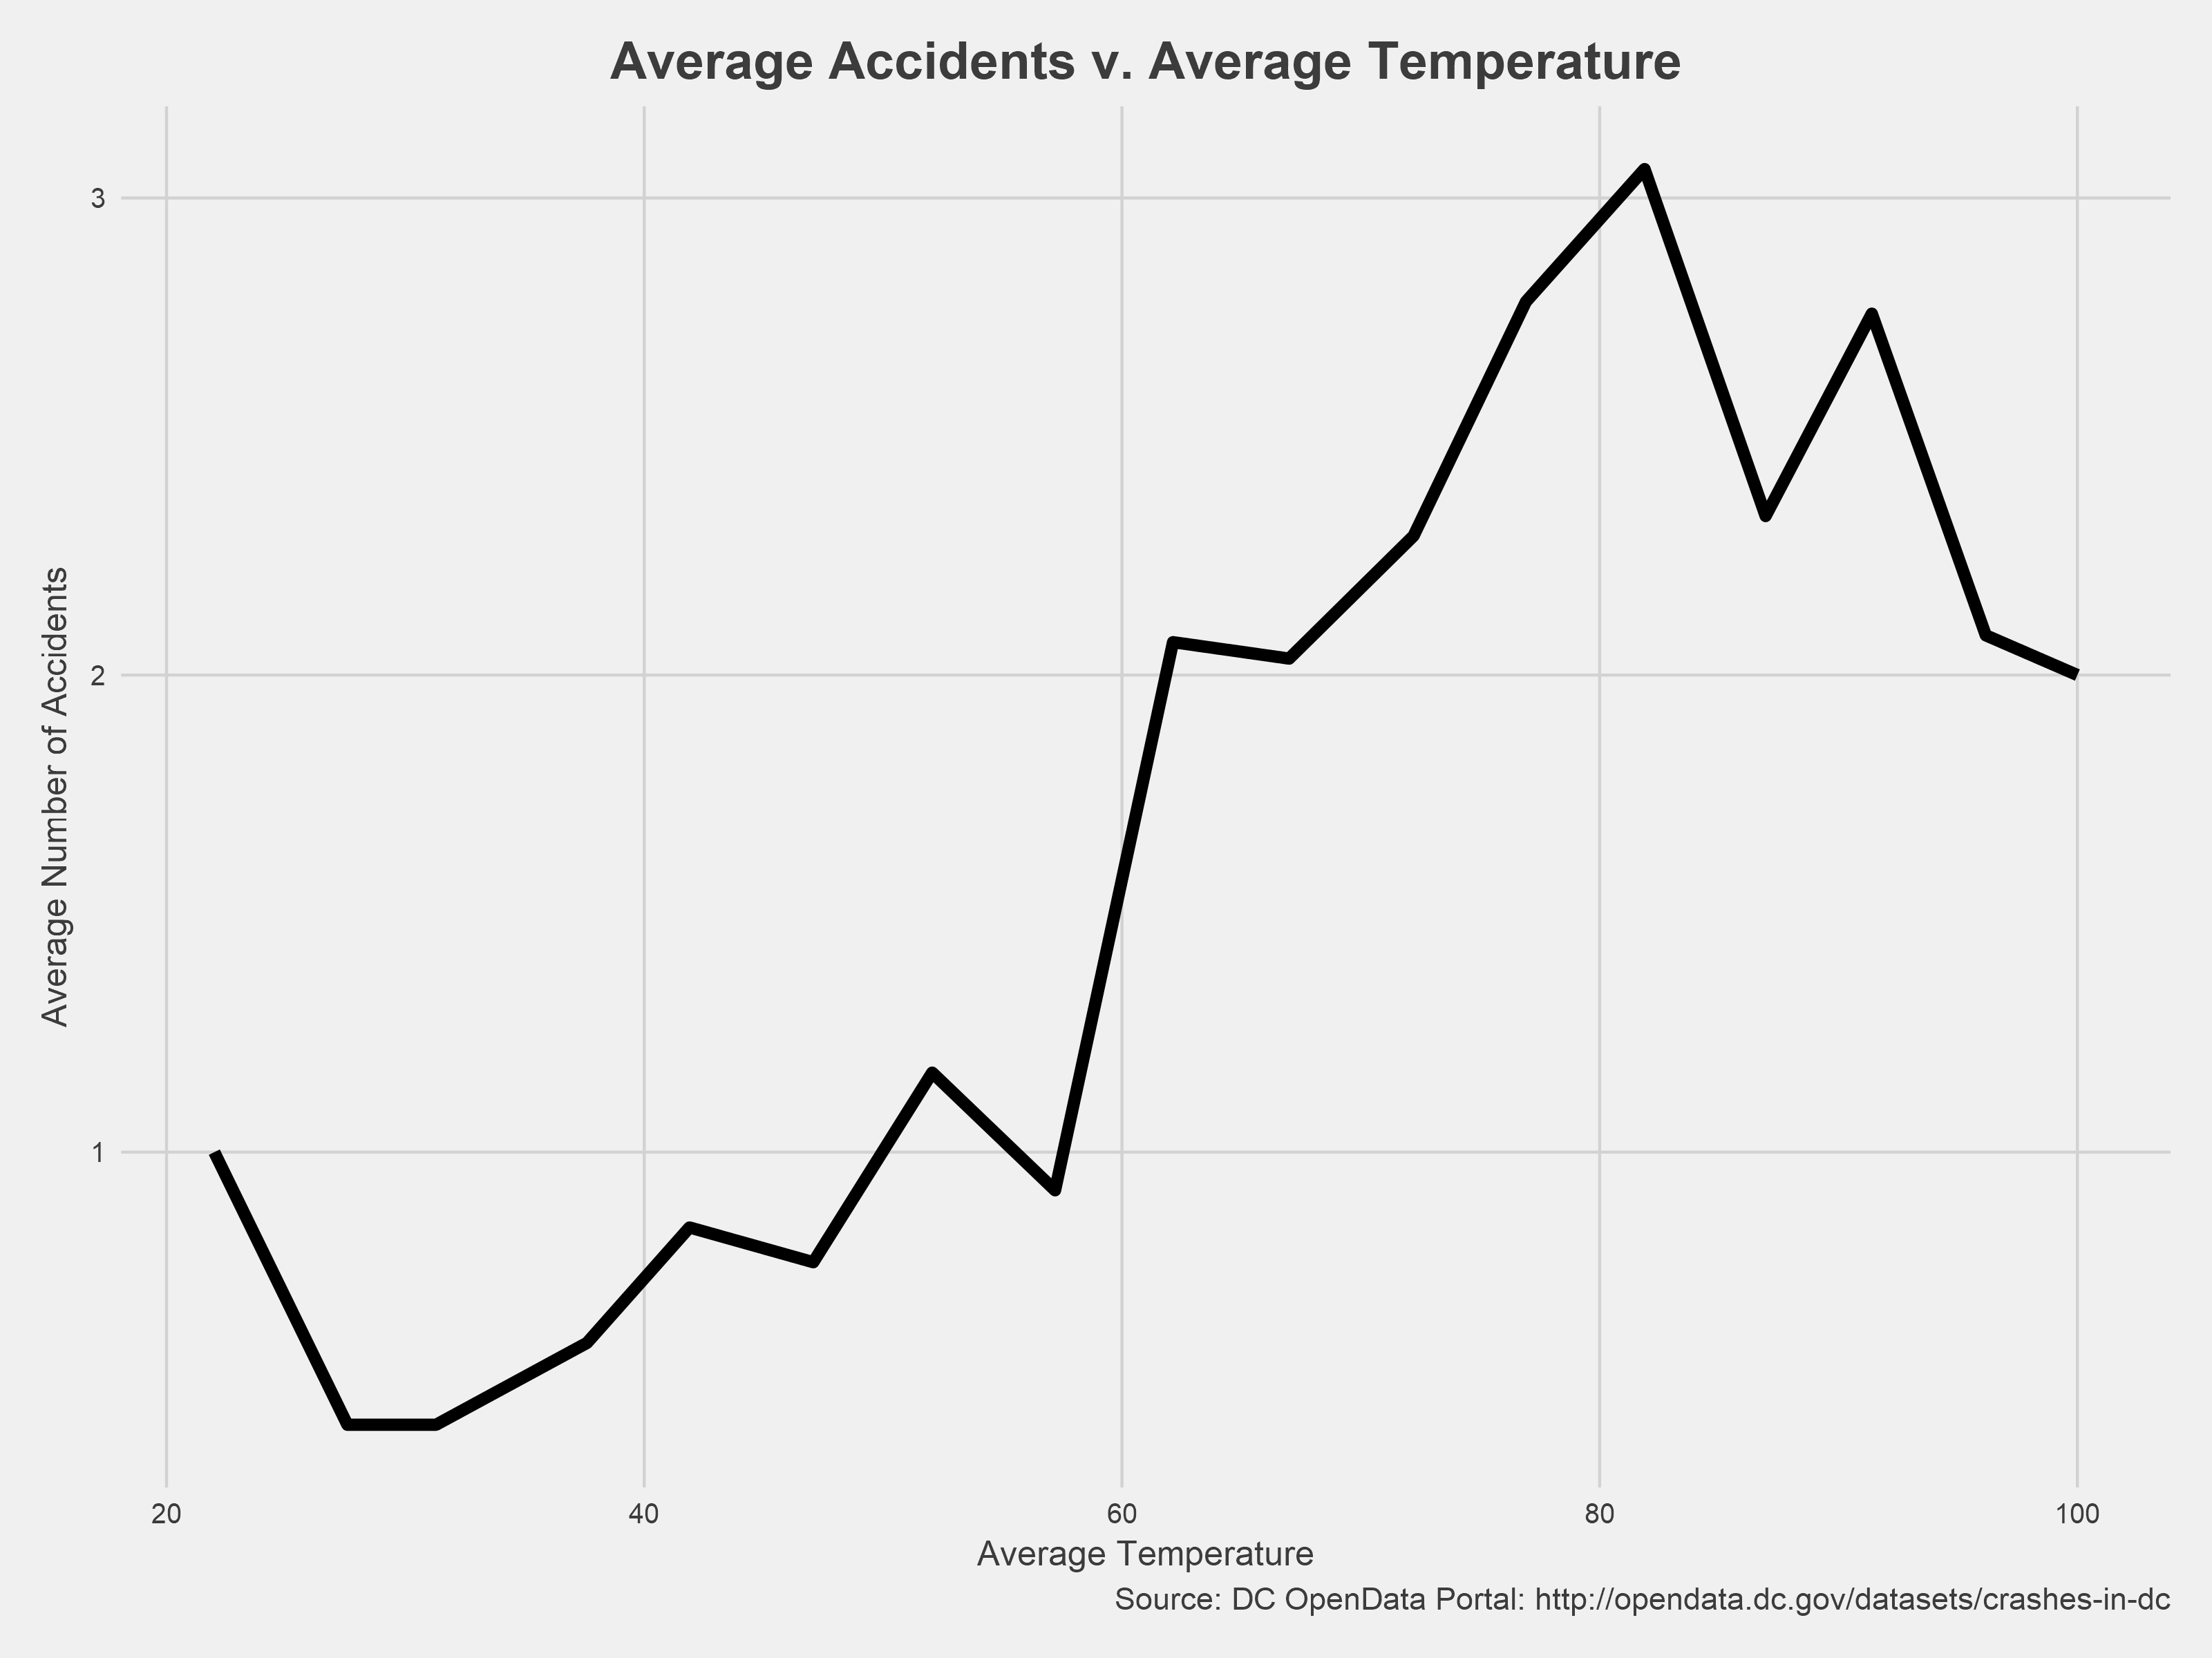
If we take this a step further and look at the average number of accidents by daily temperature using data from the National Weather Service, we find that warmer weather (independent of month) is generally associated with higher levels of accidents - up until a certain point. Days with an max temperature of 80 degrees, on average, have 3 accidents involving bicycles, while days with a maximum of 100 degrees have 2 accidents.
Also, on average there are less accidents on 40 degree days than 20 & 60 degree days.
So, it does appear that even though there are more bikers on the road during the summer months, there are fewer accidents than in the fall months.
Conclusion and Final Thoughts
That’s it (for now)! Thanks for reading/skimming/looking at the charts. I was able to look at a number of the “What and Where” type questions in this analysis. However, the biggest omission is the “Why” do these bicycle accidents happen, which is the hardest to answer. There are a number of really interesting projects attempting to answer this question, such as the City of Boston’s Crash Modeling Project, which partially inspired this project. Hopefully, I can tackle that question in a subsequent project.
All of the code and data involved in this project can be accessed here: https://github.com/GWarrenn/dc_data
Happy to answer any questions/comments/criticism/rants: augustjwarren@gmail.com
- As noted in the monthly section, there appears to be a bit of a lag in 2017 reporting. The number of accidents in the summer of 2017 is much lower than 2016, while the late-winter/spring of 2017 have similar levels as 2016.